Build a Time-Series Metrics Store
databases data-engineering performance
System Design Deep Dive
Time-Series Metrics Store
Compressing billions of data points to serve dashboard range queries in milliseconds while aging data out gracefully
Consider a system that records a CPU utilization sample every 10 seconds from 500,000 hosts. That’s 50,000 data points per second, 4.3 billion per day, 65 trillion per 15-day retention window - before we even add memory, disk I/O, network throughput, and application-layer metrics. If you stored each data point as a naive (metric_id, timestamp, value) row in Postgres, you’d need 1.5TB per day just for the row overhead alone. Postgres would collapse under the index maintenance burden within hours.
A time-series store is a specialized database built around one insight: consecutive samples for the same metric are highly correlated. CPU utilization at 10:00:10 is usually close to CPU utilization at 10:00:00. Temperature readings change slowly. HTTP request rates follow predictable daily cycles. That correlation is money - it means you can compress sequences of 64-bit floats down to sequences of 1-4 bit deltas using delta-of-delta encoding, and achieve 10:1 to 20:1 compression ratios without losing a single bit of precision.
The challenge is that this specialization comes with a set of constraints you have to design around carefully. You need to handle out-of-order writes (a host that was offline for 2 minutes resends backlogged samples), cardinality explosions (a metric with 50 label dimensions generates 50^50 possible series), chunk lifecycle management (flushing in-memory data to disk without blocking ingestion), and a downsampling pipeline that computes 1-hour averages from 10-second raw data before the raw data ages out.
We need to solve for write throughput (50K data points/second), query latency (sub-100ms for dashboard range scans), compression ratio (16:1 target), and clean retention transitions at 15 days (raw -> downsampled) and 1 year (downsampled -> cold archive).
Requirements and Constraints
Functional Requirements
- Ingest metrics with labels:
metric_name{label_key=label_value, ...} value timestamp - Support range queries: fetch all samples for a metric series over a time range
- Support downsampling queries: fetch pre-computed 1-minute and 1-hour aggregates
- Enforce retention: raw data kept 15 days, 1-minute rollups kept 1 year, 1-hour rollups kept 5 years
- Support label-based series selection:
cpu{host="web-01", region="us-east"}
Non-Functional Requirements
- Write throughput: 50,000 data points/second (4.3B/day) sustained, 200K/second burst
- Query latency: p99 under 100ms for 24-hour range scans over 100 series
- Compression: 10:1 minimum on raw data (16:1 target with Gorilla encoding)
- Series cardinality: support up to 10 million active series
- Availability: 99.9% for writes; 99.5% for reads (reads can serve stale data)
- Retention transitions: automated, no manual intervention
Constraints
- Out-of-order writes accepted within a 2-hour window; older backfill requires a separate import API
- Label cardinality per metric limited to 1 million distinct series (prevents cardinality bombs)
- Exact percentile calculation over downsampled data is not supported - only min/max/avg
High-Level Architecture
The system has five major components: an Ingest API, a Write-Ahead Log (Kafka), an In-Memory Store (chunks per series), a Persistent Block Store (object storage + index), and a Retention Manager.
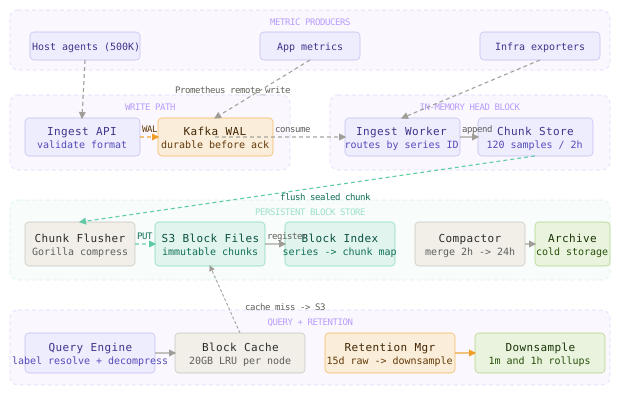
Incoming metrics hit the Ingest API, which validates the metric format and publishes to Kafka for durability. The Ingest Worker maintains in-memory chunks per series - a chunk is a compressed sequence of (timestamp, value) pairs for one series covering a 2-hour window. When a chunk fills (typically 120 samples), the Ingest Worker compresses it with Gorilla encoding and hands it to the Chunk Flusher, which writes the compressed block to object storage (S3) and updates the Index (a mapping from series labels to block locations).
The Query Engine resolves label selectors to series IDs using the Index, fetches relevant blocks from object storage (with a local cache), decompresses them, and returns the samples in the requested time range.
The Retention Manager runs daily, identifies blocks older than 15 days, runs the downsampling pipeline, writes 1-minute and 1-hour rollup blocks, and deletes the raw blocks.
Premium Content
Unlock the full article along with everything else in the archive — all in one place.