Build a Real-Time Analytics Dashboard at 100B Events
data-engineering scalability performance
System Design Deep Dive
Real-Time Analytics Dashboard
Ingesting 100B events/day while answering arbitrary aggregate queries in under a second - without precomputing everything
Imagine you’re building a product analytics platform. Your users fire events - page views, button clicks, API calls, purchases - at a rate of 1.2 million per second. On the other end, a product manager has a dashboard open with 12 widgets, each asking a different aggregate: “How many users clicked checkout in the last 30 minutes, broken down by country?” They refresh it constantly. They want answers in under a second.
The naive solution is to precompute every possible aggregate. But “every possible aggregate” over arbitrary time windows, arbitrary filter combinations, and arbitrary grouping dimensions is combinatorially explosive. For a dataset with 100 dimensions and 10 possible values per dimension, precomputing all combinations would require 10^100 aggregates. That’s not a storage problem; it’s a physics problem.
The real tension is between write throughput and query flexibility. Precomputed roll-ups give you fast reads but lock you into fixed query shapes. Raw event storage gives you full flexibility but makes queries prohibitively slow on 100 billion events. Neither extreme works. The architecture we’re designing lives in the middle: pre-aggregate at coarse granularities, store columnar raw data for fine-grained queries, and use approximate algorithms where exactness isn’t required.
We need to solve for sub-second query latency, flexible dimension grouping, real-time freshness (events visible within 10 seconds of ingestion), and a write path that doesn’t melt under 1.2M events/second.
Requirements and Constraints
Functional Requirements
- Ingest arbitrary event types with flexible schema (event name, timestamp, user ID, arbitrary key-value properties)
- Support aggregate queries:
COUNT,SUM,COUNT DISTINCT,PERCENTILEover any dimension combination - Support time window queries: last N minutes, fixed time ranges, rolling windows
- Provide real-time results - events ingested within 10 seconds must appear in query results
- Support dashboard-style queries with multiple concurrent aggregations
Non-Functional Requirements
- Ingest: 1.2 million events/second peak (100 billion events/day)
- Query latency: p99 under 1 second for dashboard queries
- Freshness: 10-second event visibility SLA
- Storage: 90-day hot retention, 2-year cold retention
- Availability: 99.9% uptime for query path
- Concurrent dashboard users: up to 50,000 active dashboards
Constraints
- Exact
COUNT DISTINCTat this scale requires HyperLogLog approximation (within 2% error) - Pre-aggregation is limited to fixed dimensions and 1-minute granularity
- Cross-dataset joins are not supported in real-time queries
- Schema changes require a migration window
High-Level Architecture
The system splits into four major subsystems: an ingestion tier, a stream processing layer, a dual-store (columnar raw + materialized roll-ups), and a query federation layer.
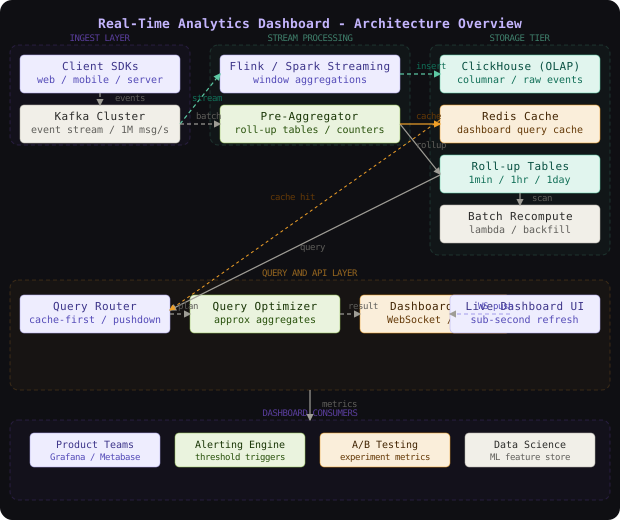
Events arrive at the Ingestion API, a stateless fleet of HTTP servers that validate, enrich (adding server-side timestamps and geo-tags), and publish events to Kafka. Kafka acts as the durable buffer - it absorbs write bursts and decouples the ingestion rate from the processing rate.
The Stream Processor (Apache Flink) reads from Kafka and maintains two outputs: it writes raw events to ClickHouse (a columnar OLAP store optimized for analytical scans) and it writes pre-aggregated roll-ups to Redis for ultra-low-latency dashboard reads.
The Query Layer is a federation service: for recent data (last 30 minutes), it reads pre-aggregated roll-ups from Redis. For historical queries, it routes to ClickHouse and executes columnar scans. Results are merged and returned.
Premium Content
Unlock the full article along with everything else in the archive — all in one place.