Build a Model Versioning and A/B Testing System for ML
deployment reliability data-engineering
System Design Deep Dive
Model Versioning and A/B Testing
Split traffic to a new model, measure it against the old, and roll back the instant it loses.
A highway department repaving a bridge deck does not close all six lanes overnight and gamble that the new asphalt holds under a full day of traffic. It opens one lane, watches it carry a small fraction of the cars first, and keeps a crew standing by who can throw up cones and route everyone back onto the old lanes within minutes if the new surface cracks. Shipping a new machine learning model into a system that scores 200,000 inference requests a second is the same problem wearing different clothes. You cannot cut every request over to a freshly trained model and hope its offline validation metrics translate cleanly to live traffic, because they often do not.
The closer analogy is a clinical drug trial. A new drug is never given to every patient the day it clears the lab. It is given to a randomly assigned fraction of patients while the rest continue on the existing standard of care, and a safety monitoring board watches the trial’s outcomes continuously, empowered to halt it the moment the new drug looks like it is doing more harm than good, well before the trial reaches its planned end date. A model versioning and A/B testing system is that trial infrastructure built into an inference pipeline: a model registry that tracks exactly which version is control and which is the challenger, a routing layer that assigns each user to one arm of the experiment and keeps them there, a metrics pipeline that watches the business outcome for each arm separately, and a monitoring board, implemented as code, that pulls the plug automatically when the challenger is losing.
The naive approach, deploy the new model behind a flag and eyeball a dashboard for a week, fails for reasons that only show up at scale. A model serving 200,000 requests a second across 500 registered versions and 50 concurrent experiments cannot be evaluated by a human staring at a graph, because the graph is noisy. A 0.3% dip in conversion rate over one hour is completely ordinary sampling variance for most products, and reacting to every dip means the challenger never gets a fair trial. Worse, if the same user sees the old model on one request and the new model on the next, no metric computed downstream means anything, because you can no longer attribute a purchase or a click to the model that actually produced the recommendation the user acted on. And if the team decides to roll back manually after spotting a problem in a dashboard, the decision typically lands hours after the damage was already done to tens of millions of served requests.
The forces in tension are speed against confidence, and isolation against realism. We need a router that assigns traffic instantly, adding no meaningful latency to the hot inference path, while guaranteeing that one user’s experience stays consistent for the entire life of an experiment. We need a metrics system that separates signal from noise fast enough to catch a bad model within minutes, not weeks, without falsely killing challengers that are actually fine. And we need a rollback mechanism that acts automatically, because deciding “this is really worse, not just noisy” is exactly the kind of statistical judgment call a computer can make faster and more consistently than an on-call engineer at 3 AM. We need to solve for traffic splitting that is deterministic and sticky, metric collection that is attributable to the exact model version that produced each prediction, and statistical decision-making that is both fast and resistant to false alarms, all at the same time.
Requirements and Constraints
Functional Requirements
- Register every trained model artifact in a
model registrywith a unique version, lineage (training run, parent version), and a promotion state (staging,shadow,canary,production,deprecated,archived) - Split live inference traffic between two or more versions of the same model according to a configured percentage, routing each request deterministically to exactly one variant
- Guarantee that the same entity (typically a user) is assigned to the same variant for the full duration of an experiment, even across router restarts and rolling deploys (
experiment assignment consistency) - Run a challenger model in
shadow mode: score production traffic against it without ever returning its prediction to the caller, purely to compare its predictions and latency against the currently served model before it earns any live traffic - Collect business metrics, not just model accuracy, per model variant, tagged with the same experiment and variant identifiers used for routing (
metric collection per variant) - Continuously test whether the difference in a guardrail metric between variants is statistically significant, not just directionally different (
statistical significance testing) - Automatically reduce a challenger’s traffic allocation to zero when it breaches a guardrail metric with statistical confidence, without waiting for a human to intervene (
automatic rollback triggers) - Allow an operator to manually pause, override, or force-promote an experiment at any point
Non-Functional Requirements
- Scale: 200,000 inference requests/sec at peak across the serving fleet, 500 registered model versions, 50 concurrent experiments, roughly 20 million daily active entities receiving an assignment
- Routing latency: the assignment decision adds no more than 1ms at p99 on top of the model’s own inference latency
- Assignment consistency: 100% of repeat requests from the same entity within an experiment’s lifetime resolve to the same variant, continuously verified
- Metrics freshness: guardrail metrics roll up into 5-minute windows, available to the statistical engine within 60 seconds of window close
- Statistical rigor: a 0.01 significance threshold (99% confidence) on guardrail metrics before an automatic rollback fires, with a minimum sample size of 10,000 assigned entities per variant before any test is evaluated
- Rollback latency: under 3 minutes end to end, from a confirmed guardrail breach to challenger traffic reaching 0%
- Availability: 99.99% for the traffic router and serving path; the statistical analysis and rollback path can tolerate a few minutes of delay without materially changing the outcome
- Durability: every assignment, prediction event, and rollback decision is logged and retained for at least 180 days for audit and post-hoc analysis
Constraints and Assumptions
- We are not building the model training pipeline or the feature store that supplies inference inputs; this design assumes trained model artifacts and computed features already exist
- We are not building a general-purpose statistics platform for arbitrary product experiments like pricing or UI copy; this focuses specifically on ML model rollout experiments, though the primitives generalize
- We assume model artifacts are already validated offline (held-out test set, bias checks) before entering the registry; this system governs the online rollout, not offline model quality
- We assume the inference serving infrastructure itself (the GPU/CPU fleet, autoscaling) already exists; this design covers the routing, measurement, and rollback layer sitting on top of it
High-Level Architecture
The system has six major components: the Model Registry, the Traffic Router, the Shadow Evaluation path, the Metrics Pipeline, the Statistical Analysis Engine, and the Rollback Controller.
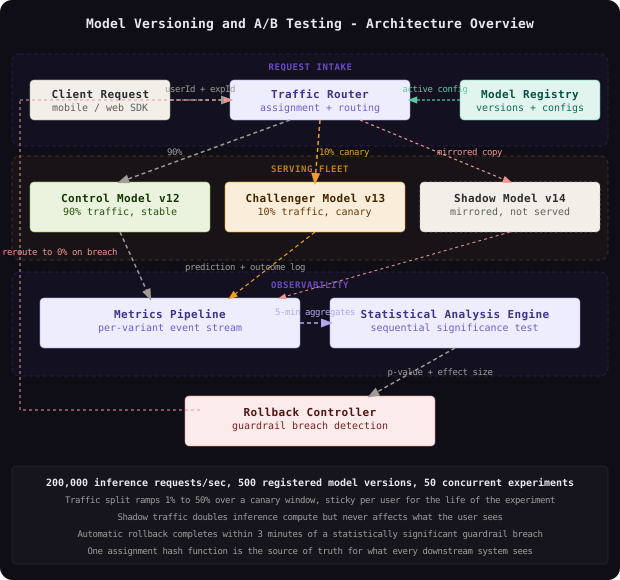
A request carrying an entity identifier arrives at the Traffic Router, which first checks the Model Registry for the active experiment configuration on the requested model slot: which versions are eligible, and what split percentages apply. The router deterministically resolves the entity to a variant, forwards the request to the control model on the serving fleet for the overwhelming majority of traffic, and to the challenger model for the configured canary percentage. In parallel, and completely invisibly to the caller, a configured fraction of traffic is also mirrored to any model running in shadow mode, whose response is scored and logged but never returned. Every served and shadowed prediction, along with any business outcome that follows it, streams into the Metrics Pipeline, which rolls per-variant events into short aggregation windows. The Statistical Analysis Engine reads those windows continuously and tests whether the challenger’s guardrail metrics differ from control’s by more than chance. When that test confirms a real regression, the Rollback Controller reduces the challenger’s traffic allocation back to the router’s configuration, closing the loop without a human in it.
The Model Registry sits beside the request path rather than inside it. The router reads the registry’s cached configuration on every request, but the registry itself is a control-plane system, not a data-plane one; its writes happen when engineers register new model versions or when the Rollback Controller updates a split percentage, not on every inference call.
The single most important architectural decision is that traffic assignment is a pure function of the entity id and the experiment’s salt, computed independently by every router replica, rather than a value looked up from shared mutable state. That is what makes the router both fast (no network round trip to decide) and consistent (every replica computes the identical answer for the identical input, with no coordination required).
Component Deep Dives
The Model Registry
This component’s job is to be the definitive, versioned record of every model artifact allowed to receive live traffic, and the promotion state that governs whether it currently can.
Think of it like a hospital’s drug formulary. Nothing gets administered to a patient unless it is on the approved list, its exact batch is traceable back to a manufacturing run, and its current status, approved, restricted, or recalled, is checked before every dose. The registry plays the same role for a model version: model_version_id is the batch number, promotion_state is the formulary status, and no router, ever, is allowed to route traffic to a version by convention or by directory name instead of by an explicit registry lookup.
-- Model registry: every artifact, its lineage, and its current promotion state
CREATE TABLE model_versions (
    model_version_id      BIGSERIAL PRIMARY KEY,
    model_name              TEXT NOT NULL,
    version_number             INTEGER NOT NULL,
    artifact_uri                  TEXT NOT NULL,
    training_run_id                 TEXT NOT NULL,
    parent_version_id                 BIGINT REFERENCES model_versions(model_version_id),
    promotion_state                     TEXT NOT NULL DEFAULT 'staging'
        CHECK (promotion_state IN ('staging', 'shadow', 'canary', 'production', 'deprecated', 'archived')),
    created_at                             TIMESTAMPTZ NOT NULL DEFAULT NOW(),
    UNIQUE (model_name, version_number)
);

-- Only one production version per model slot, outside a brief migration window
CREATE UNIQUE INDEX one_production_per_model
    ON model_versions (model_name)
    WHERE promotion_state = 'production';

CREATE INDEX ON model_versions (model_name, promotion_state);
If you skip the registry and let the router simply point at whatever artifact happens to live in a path called latest, a training job that overwrites latest mid-experiment silently swaps out the challenger a live experiment is measuring. Every metric collected before and after that swap gets attributed to a single model_version_id in your dashboards, when it was actually produced by two different models, and there is no trace of when the swap happened. The registry closes that gap by making the artifact reference immutable once a model_version_id is created; a new artifact always means a new row, never an update to an existing one.
Allowing two versions of the same model to sit in production state simultaneously, even briefly during a migration, is how routers end up disagreeing about which model is “the” control. Enforce it with a partial unique index like one_production_per_model and route any legitimate transition through an explicit canary to production state change, never a direct double-write.
MLflow’s Model Registry and Uber’s Michelangelo both center on exactly this pattern, a model is not a file on disk, it is a versioned, stateful record that every consuming system resolves through a registry API rather than by convention.
The Traffic Router
This component’s job is to look at an incoming request’s entity id and the active experiment configuration, and deterministically decide which model version answers it, in well under a millisecond, and to keep answering that same way for as long as the experiment runs.
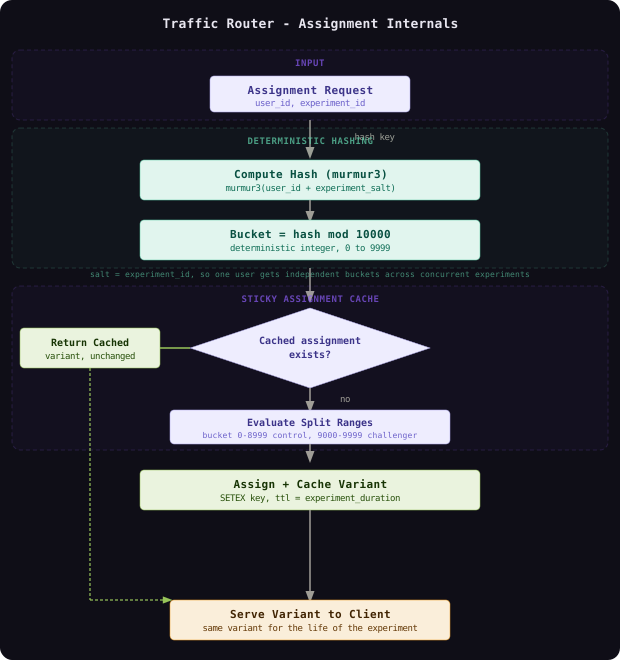
A smart engineer’s first instinct is to roll a random number on every request to hit the configured 90/10 split. That destroys the one property the whole system depends on: if the same user sees the control model on one request and the challenger on the next, no downstream business metric can be attributed to a specific model version, because the user’s session is a blend of both. The fix is deterministic hashing instead of per-request randomness, assignment consistency achieved not by remembering a decision, but by recomputing the same answer every time from the same inputs.
// Traffic router: resolves a request's entity id to a variant, in-process,
// with no network round trip on the hot path
package router

import (
	"context"
	"time"

	"github.com/spaolacci/murmur3"
)

type Variant struct {
	Role           string // "control", "challenger", or "shadow"
	ModelVersionID int64
	SplitBucketMax uint32 // exclusive upper bound in [0, 10000)
}

type Experiment struct {
	Salt     string
	Variants []Variant // sorted so the challenger owns the lowest buckets
}

const bucketSpace = 10000

// assignmentBucket is a pure function: same entityID and salt always produce
// the same bucket, with no shared state and no cache dependency.
func assignmentBucket(entityID, salt string) uint32 {
	h := murmur3.Sum32([]byte(entityID + ":" + salt))
	return h % bucketSpace
}

func ResolveVariant(entityID string, exp Experiment) Variant {
	bucket := assignmentBucket(entityID, exp.Salt)
	for _, v := range exp.Variants {
		if bucket < v.SplitBucketMax {
			return v
		}
	}
	return exp.Variants[len(exp.Variants)-1] // control, the catch-all range
}

// Route resolves the variant, checks a local sticky cache purely as a
// latency optimization (not a source of truth), and forwards the request.
func Route(ctx context.Context, entityID string, exp Experiment, cache StickyCache) (Variant, error) {
	if cached, ok := cache.Get(entityID, exp.Salt); ok {
		return cached, nil
	}
	v := ResolveVariant(entityID, exp)
	cache.SetEX(entityID, exp.Salt, v, 24*time.Hour)
	return v, nil
}
A consistent hash bucket is like a raffle where every ticket number is printed once, at issue time, and never redrawn. A ticket holder’s fate is decided the moment their number is printed, not re-rolled every time someone shakes the box. Because assignmentBucket is a pure function of the entity id and the experiment’s salt, any router replica, anywhere, computes the identical bucket, so the sticky cache in Route is strictly an optimization. If the cache is cold, evicted, or the router restarts, recomputing the hash returns the exact same answer, no state was ever actually lost.
Salting the hash by model_name instead of by experiment_salt correlates assignment across every experiment that model ever runs, the same 10% of users always land in the challenger bucket for every future experiment on that model, which quietly biases who your canary population is over time. Generate a fresh, unique salt per experiment so assignment is independent across concurrent and sequential experiments on the same model.
Google’s Overlapping Experiment Infrastructure and Meta’s PlanOut framework both use exactly this salted-hash technique, independent per-experiment randomization from a single deterministic function, so thousands of experiments can run concurrently on overlapping user populations without one experiment’s assignment leaking into another’s.
Shadow Mode Evaluation
This component’s job is to let a challenger model score real production traffic, in parallel with the model actually serving the response, without ever influencing what the user sees, so prediction quality and latency get validated under real load before the challenger earns a single percentage point of live traffic.
Shadow mode is like a co-pilot trainee sitting in the jump seat with a dummy control yoke, mirroring every input the flying pilot makes so instructors can see exactly what the trainee would have done, without ever risking the actual flight. Jumping straight to serving 1% of real users to a brand-new challenger risks exposing real users to a basic bug, a model that always predicts zero, a serialization mismatch, a timeout under real traffic shapes, that shadow mode would have caught with precisely zero user impact.
// Shadow dispatch: fire-and-forget mirror of the request to a shadow model,
// never blocking or slowing the response the caller actually receives
func DispatchShadow(ctx context.Context, req InferenceRequest, shadowVersion int64, metrics MetricsSink) {
	if !shouldSampleShadow(req.EntityID, sampleRate: 0.10) {
		return
	}
	go func() {
		shadowCtx, cancel := context.WithTimeout(context.Background(), 200*time.Millisecond)
		defer cancel()

		start := time.Now()
		pred, err := callModel(shadowCtx, shadowVersion, req.Features)
		latency := time.Since(start)

		if err != nil {
			metrics.RecordShadowError(shadowVersion, err)
			return // never propagates to the served response
		}
		metrics.RecordShadowPrediction(shadowVersion, req.EntityID, pred, latency)
	}()
}
Shadow traffic effectively doubles the inference compute cost for any model it mirrors, since every request now runs through two model forward passes instead of one. shouldSampleShadow mitigates that by mirroring a configurable fraction, 10% here, rather than 100% of traffic, and the hard 200ms timeout combined with the detached goroutine guarantees a slow or crashing shadow model can never add latency to, or fail, the response the user actually gets.
Running shadow scoring synchronously in the same request goroutine that produces the served response, even with a timeout, still ties the shadow model’s tail latency to the user-facing p99 under load, because the goroutine scheduler and downstream connection pools are shared resources. Dispatch shadow calls asynchronously against an independent resource pool, not just an independent goroutine, so a shadow model under stress cannot starve the serving path.
Meta’s model deployment pipeline runs every candidate ranking model in shadow mode against a slice of live traffic before it becomes eligible for any canary percentage, specifically to catch integration bugs, feature mismatches, and latency regressions that never show up in offline evaluation against a static test set.
The Metrics Pipeline
This component’s job is to collect the business outcome of every served and shadowed prediction, tag it with the exact model version and experiment that produced it, and roll it up into per-variant aggregates fast enough for a rollback decision to act on within minutes.
If a drug trial’s notebook did not separately track which patients received the placebo, no result the study produced would mean anything. Every downstream statistic depends on faithfully tagging each outcome to the arm that actually produced it, and the subtlest bug in this component is not dropping events, it is misattributing them.
-- Prediction and outcome events, tagged with the variant active at
-- prediction time, not looked up again when the outcome arrives
CREATE TABLE metric_events (
    event_id                BIGSERIAL,
    entity_id                  TEXT NOT NULL,
    experiment_id                 BIGINT NOT NULL,
    variant_id                       BIGINT NOT NULL,
    metric_name                         TEXT NOT NULL,
    metric_value                            DOUBLE PRECISION NOT NULL,
    event_type                                  TEXT NOT NULL CHECK (event_type IN ('prediction', 'outcome')),
    event_time                                      TIMESTAMPTZ NOT NULL,
    event_date                                          DATE NOT NULL,
    PRIMARY KEY (event_id, event_date)
) PARTITION BY RANGE (event_date);

CREATE INDEX ON metric_events (experiment_id, variant_id, metric_name, event_time);
# Near-real-time counters for the current 5-minute window, one hash per
# (experiment, variant, metric) so a rollback decision never waits on a
# full table scan
HINCRBYFLOAT win:exp_4471:challenger:conversion_rate sum 1.0
HINCRBYFLOAT win:exp_4471:challenger:conversion_rate sum_sq 1.0
HINCRBY win:exp_4471:challenger:conversion_rate count 1
EXPIRE win:exp_4471:challenger:conversion_rate 900A user’s outcome, a purchase, a cancellation, often arrives seconds or minutes after the prediction that led to it, sometimes after the user has closed the app and reopened it on a newer build. If the outcome event looks up “the current assignment” at write time instead of reusing the variant_id that was active when the prediction was actually served, a delayed conversion can get attributed to the wrong arm entirely. The schema above avoids that by denormalizing variant_id directly onto every event at the moment it is written, prediction or outcome, so no later join can silently corrupt attribution.
Re-deriving a metric event’s variant by joining against a live assignment table at aggregation time, rather than trusting the variant_id stamped on the event itself, is the single most common source of silent misattribution in experimentation pipelines. An assignment lookup answers “what would this entity be assigned right now”, which is not the same question as “what was this entity assigned when this specific prediction was served.”
The Statistical Analysis Engine
This component’s job is to continuously test whether the observed difference in a guardrail metric between control and challenger is real, not sampling noise, and to do that without inflating the false-positive rate from checking the result over and over as data streams in.
Checking whether a coin is biased by flipping it and declaring “unfair” the instant three heads appear in a row, then resetting your count if you do not like the answer, is exactly what naively peeking at a fixed-horizon p-value does every time a dashboard refreshes. A team watching an experiment’s dashboard checks it dozens of times a day whether or not classical statistics says it is safe to look, and every one of those checks against a standard two-sample t-test’s p-value inflates the true false-positive rate well beyond the nominal 1%.
The fix is a sequential testing method built to stay valid under continuous monitoring, computed here from pre-aggregated window statistics rather than raw events, since the engine only needs sample_count, sum_value, and sum_sq_value per variant per window to reconstruct a mean and variance.
The property that makes this safe to check every five minutes for the entire life of an experiment is that the test’s significance level is constructed as an always-valid confidence sequence, not a single fixed-horizon calculation. Alpha holds no matter how many times, or how early, the result gets inspected, which is exactly how engineers actually use these dashboards in practice.
Feeding a heavy-tailed metric like raw order revenue directly into a normal-approximation z-test breaks the test’s assumptions the moment a handful of unusually large orders land in one variant’s window. Winsorize or log-transform metrics with long tails before they reach the significance test, or the test’s nominal alpha stops matching its actual false-positive rate.
The Rollback Controller
This component’s job is to translate a statistically confirmed guardrail breach into an automatic, immediate reduction of a challenger’s traffic allocation back to zero, without waiting on a human, while avoiding flapping on borderline noisy results.
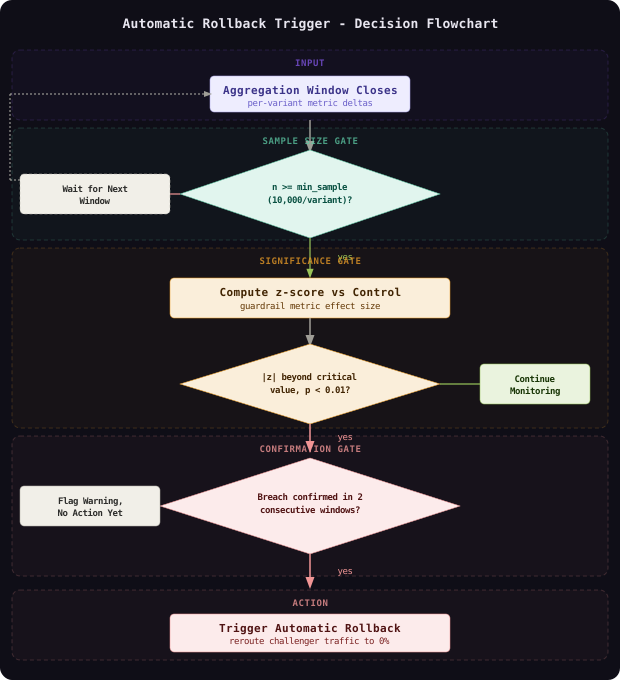
Think of it like a circuit breaker in a house. A well-designed breaker does not trip on the first millisecond of a power surge, it trips within a few hundred milliseconds of sustained overcurrent, fast enough to prevent real damage, slow enough to ignore a single harmless flicker from a refrigerator compressor kicking on. Rolling back on the very first aggregation window that crosses the significance threshold sounds appealingly fast, but with 50 concurrent experiments each checking several guardrail metrics every 5 minutes, pure chance guarantees frequent single-window false alarms unless the controller requires confirmation across consecutive windows before it acts.
# Rollback controller: acts only after a guardrail breach is confirmed in
# consecutive windows, never on the first significant result alone
from dataclasses import dataclass

@dataclass
class GuardrailState:
    consecutive_breaches: int = 0
    required_confirmations: int = 2

def rollback_trigger(state: GuardrailState, guardrail_result: dict) -> tuple[bool, GuardrailState]:
    if guardrail_result["status"] != "breach":
        state.consecutive_breaches = 0
        return False, state

    state.consecutive_breaches += 1
    if state.consecutive_breaches >= state.required_confirmations:
        return True, state
    return False, state

def apply_rollback(experiment_id: int, variant_id: int, registry_client) -> None:
    # Sets the challenger's split_bucket_max to 0 and records the reason;
    # control's catch-all range absorbs 100% of traffic immediately
    registry_client.update_split(experiment_id, variant_id, split_bucket_max=0)
    registry_client.log_rollback_event(experiment_id, variant_id, reason="guardrail_breach_confirmed")
What would break if you skipped the confirmation gate entirely is not a hypothetical, it is the default failure mode of any team that ships the first version of this system: with enough concurrent experiments and enough guardrail metrics per experiment, a 1% false-positive rate per test guarantees several false rollbacks a day purely from multiple testing, and engineers quickly lose trust in the automation and start disabling it.
The most common operational mistake teams make here is requiring all guardrail metrics to agree before rolling back, rather than any single one. A challenger that improves conversion rate while its crash rate silently doubles is not a wash, it is a regression on a metric that matters more than the one that improved, and a single breached guardrail should be sufficient to trigger rollback regardless of what other metrics say.
Data Model
The durable state splits into the model registry tables shown above, a durable assignment log for audit and point-in-time analysis, the metric event log, its pre-aggregated windows, and a record of every automatic rollback decision.
-- Experiments and the variants competing within them
CREATE TABLE experiments (
    experiment_id            BIGSERIAL PRIMARY KEY,
    model_name                 TEXT NOT NULL,
    experiment_salt              TEXT NOT NULL UNIQUE,
    status                          TEXT NOT NULL DEFAULT 'running'
        CHECK (status IN ('running', 'paused', 'rolled_back', 'completed')),
    started_at                        TIMESTAMPTZ NOT NULL DEFAULT NOW(),
    ended_at                             TIMESTAMPTZ
);

CREATE TABLE experiment_variants (
    variant_id             BIGSERIAL PRIMARY KEY,
    experiment_id             BIGINT NOT NULL REFERENCES experiments(experiment_id),
    model_version_id             BIGINT NOT NULL REFERENCES model_versions(model_version_id),
    variant_role                     TEXT NOT NULL CHECK (variant_role IN ('control', 'challenger', 'shadow')),
    traffic_split_bucket_max             INTEGER NOT NULL CHECK (traffic_split_bucket_max BETWEEN 0 AND 10000),
    UNIQUE (experiment_id, variant_role)
);

-- Durable assignment log, sharded by entity for point-in-time correctness
CREATE TABLE assignments (
    entity_id               TEXT NOT NULL,
    experiment_id              BIGINT NOT NULL REFERENCES experiments(experiment_id),
    variant_id                    BIGINT NOT NULL REFERENCES experiment_variants(variant_id),
    bucket                            INTEGER NOT NULL,
    assigned_at                          TIMESTAMPTZ NOT NULL DEFAULT NOW(),
    PRIMARY KEY (entity_id, experiment_id)
) PARTITION BY HASH (entity_id);

-- Pre-aggregated rolling windows the statistical engine reads
CREATE TABLE metric_window_aggregates (
    experiment_id             BIGINT NOT NULL,
    variant_id                   BIGINT NOT NULL,
    metric_name                     TEXT NOT NULL,
    window_start                       TIMESTAMPTZ NOT NULL,
    sample_count                          BIGINT NOT NULL,
    sum_value                                DOUBLE PRECISION NOT NULL,
    sum_sq_value                                DOUBLE PRECISION NOT NULL,
    PRIMARY KEY (experiment_id, variant_id, metric_name, window_start)
);

-- Every automatic rollback decision, kept for audit
CREATE TABLE rollback_events (
    rollback_id             BIGSERIAL PRIMARY KEY,
    experiment_id              BIGINT NOT NULL REFERENCES experiments(experiment_id),
    variant_id                    BIGINT NOT NULL REFERENCES experiment_variants(variant_id),
    metric_name                      TEXT NOT NULL,
    z_score                              DOUBLE PRECISION NOT NULL,
    p_value                                  DOUBLE PRECISION NOT NULL,
    confirmed_windows                            INTEGER NOT NULL,
    triggered_at                                    TIMESTAMPTZ NOT NULL DEFAULT NOW()
);
assignments is partitioned by a hash of entity_id, co-locating one entity’s assignment history for fast lookups and keeping the sharding key identical to the one the router uses in-process, so reasoning about consistency between the durable log and the live routing decision stays simple. metric_events is partitioned by event_date, so the aggregation job that builds metric_window_aggregates only ever scans the last few hours of partitions rather than the full 180-day retention window. The composite index on (experiment_id, variant_id, metric_name, event_time) is what makes both the aggregation job and any ad hoc “show me this experiment’s raw events” debugging query fast, since every query the system issues against this table filters on at least the leading two columns.
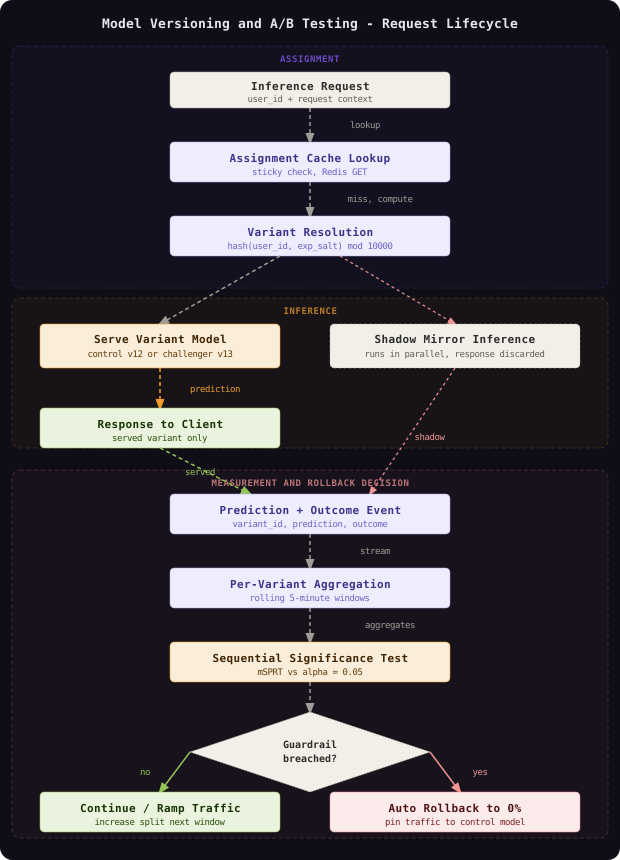
Denormalizing variant_id directly onto every metric event, rather than treating it as a foreign key to be joined against a mutable assignment table later, is what keeps attribution correct even when an entity’s assignment changes or expires between the moment a prediction was served and the moment its outcome arrives.
Key Algorithms and Protocols
Deterministic Bucket Assignment
Traffic splitting and assignment consistency are really the same algorithm viewed from two angles: a deterministic hash function that maps an entity into a bucket space, and a monotonic mapping from bucket to variant that survives the split percentage changing over time as a canary ramps up.
# Deterministic, uniformly distributed bucket assignment. Salting by
# experiment_id (not model_name) makes assignment independent across
# concurrent experiments touching the same entity.
import mmh3

BUCKET_SPACE = 10000

def assignment_bucket(entity_id: str, experiment_salt: str) -> int:
    digest = mmh3.hash(f"{entity_id}:{experiment_salt}", signed=False)
    return digest % BUCKET_SPACE

def resolve_variant(entity_id: str, experiment: dict) -> str:
    # experiment["variants"]: list of (role, split_bucket_max) sorted so the
    # challenger's range always starts at bucket 0. Raising split_bucket_max
    # as the canary ramps only ever pulls in new entities, it never moves
    # one already inside the challenger's range back out to control.
    bucket = assignment_bucket(entity_id, experiment["salt"])
    for role, split_bucket_max in experiment["variants"]:
        if bucket < split_bucket_max:
            return role
    return "control"
The lookup itself is O(1): mmh3.hash runs in constant time on a bounded-length string, and the variant loop iterates at most a handful of configured variants. No external state, no cache, and no coordination between router replicas is required for correctness, only for a latency optimization. The edge case worth naming explicitly is ramping the split percentage down mid-experiment rather than up. Shrinking split_bucket_max does move entities near the old boundary out of the challenger’s range, which violates stickiness for exactly those entities, so this design treats “ramp down” as equivalent to a full rollback to 0% rather than a partial shrink, preserving the monotonic guarantee.
The property that makes this scheme correct as a canary ramps from 1% to 50% is monotonicity. Because the challenger always owns the numerically lowest buckets, growing its split only ever adds entities to the experiment, it never reassigns someone already measured in one arm to the other.
Sequential Statistical Significance Testing
A naive two-sample z-test computed once and checked repeatedly is not actually a valid 1% significance test once you account for how many times a dashboard gets refreshed. The mixture sequential probability ratio test (mSPRT) fixes this by constructing a likelihood ratio that stays a valid statistical test no matter how many times, or how early, it gets evaluated.
# Always-valid significance testing via mixture SPRT, safe to evaluate
# after every aggregation window without inflating the false-positive rate
import math

def welch_z_statistic(n1: int, mean1: float, var1: float,
                       n2: int, mean2: float, var2: float) -> float:
    se = math.sqrt(var1 / n1 + var2 / n2)
    if se == 0:
        return 0.0
    return (mean2 - mean1) / se

def mixture_sprt_p_value(z: float, n: int, tau: float = 1.0) -> float:
    # v grows with n, damping the likelihood ratio for small samples so the
    # test cannot claim significance from a handful of early observations
    v = 1.0 + n * tau ** 2
    log_lambda = -0.5 * math.log(v) + (n * tau ** 2 * z ** 2) / (2 * v)
    lambda_n = math.exp(log_lambda)
    return min(1.0, 1.0 / lambda_n) if lambda_n > 0 else 1.0

def evaluate_guardrail(agg_control: dict, agg_challenger: dict,
                        alpha: float = 0.01, min_sample: int = 10000) -> dict:
    n1, n2 = agg_control["sample_count"], agg_challenger["sample_count"]
    if n1 < min_sample or n2 < min_sample:
        return {"status": "insufficient_sample", "p_value": None}

    mean1 = agg_control["sum_value"] / n1
    mean2 = agg_challenger["sum_value"] / n2
    var1 = max(agg_control["sum_sq_value"] / n1 - mean1 ** 2, 1e-9)
    var2 = max(agg_challenger["sum_sq_value"] / n2 - mean2 ** 2, 1e-9)

    z = welch_z_statistic(n1, mean1, var1, n2, mean2, var2)
    p = mixture_sprt_p_value(z, n=min(n1, n2))

    breached = p < alpha and mean2 < mean1  # guardrail regressed for challenger
    return {"status": "breach" if breached else "clean", "z_score": z, "p_value": p}
evaluate_guardrail never touches raw events, only the sample_count, sum_value, and sum_sq_value already sitting in metric_window_aggregates, so recomputing a fresh always-valid p-value for every experiment-metric pair on every 5-minute window costs a handful of floating point operations, not a database scan. The tau parameter is a tunable knob: a larger tau gives the test more power to detect large effects quickly at some cost to detecting small ones, and a smaller tau does the reverse, so it is set per guardrail metric based on how large a regression would actually matter operationally.
The property that makes mixture SPRT safe to check every five minutes for the entire life of an experiment is that its p-value is constructed as an always-valid confidence sequence, not a single fixed-horizon test. The nominal alpha holds regardless of how many times, or how early, the result is inspected, matching how engineers actually use these dashboards.
Rollback Confirmation State Machine
Statistical significance alone is not sufficient grounds to act; the controller also needs a debouncing mechanism so a metric that is genuinely noisy near the decision boundary cannot trigger a rollback from a single unlucky window.
# Per (experiment, metric) confirmation state, evaluated once per window.
# Confirmation resets on any clean window rather than decaying slowly.
from dataclasses import dataclass

@dataclass
class GuardrailState:
    consecutive_breaches: int = 0
    required_confirmations: int = 2

def advance(state: GuardrailState, result: dict) -> tuple[bool, GuardrailState]:
    if result["status"] != "breach":
        state.consecutive_breaches = 0
        return False, state
    state.consecutive_breaches += 1
    fire = state.consecutive_breaches >= state.required_confirmations
    return fire, state
This is O(1) per experiment-metric pair per window; at 50 concurrent experiments with roughly 5 guardrail metrics each, the controller tracks 250 small state objects in memory, trivial even at the largest scale this system targets. The edge case worth calling out is a metric that alternates between breach and clean every other window, a classic sign of a value oscillating right around the significance boundary. Because confirmation resets to zero on any clean window rather than decaying gradually, that oscillating metric never accumulates enough consecutive evidence to fire, while a metric that has genuinely regressed keeps breaching window after window and confirms within two cycles.
The property that makes this state machine safe is a hard reset on any clean window rather than a slow decay. A persistent regression accumulates confirmations quickly because every window agrees, while a metric that is merely noisy near the boundary can never build enough consecutive evidence to fire, since a single clean window wipes its progress.
Scaling and Performance
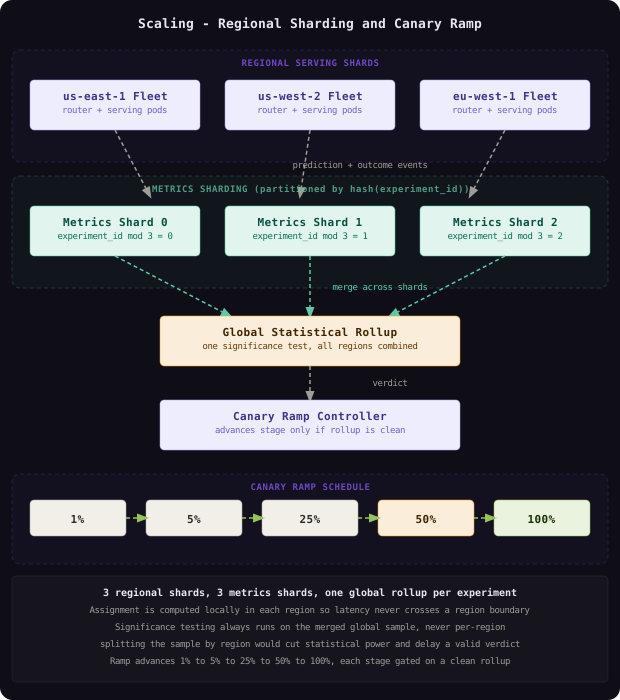
The system scales along three largely independent axes: the Traffic Router, which scales horizontally with the serving fleet since assignment is computed in-process with no shared state; the Metrics Pipeline, partitioned by a hash of experiment_id so ingestion throughput scales with shard count; and the Statistical Analysis Engine, which is compute-light relative to the data volume beneath it because it only ever operates on pre-aggregated windows.
Capacity Estimation:

Given:
  - 200,000 inference requests/sec peak across the serving fleet
  - 500 registered model versions, 50 concurrent experiments
  - 20,000,000 daily active entities receiving assignments
  - ~5% of predictions eventually produce a later outcome event
  - Guardrail aggregation window: 5 minutes, retained 180 days

Assignment path:
  Assignment lookups/sec (peak): 200,000/sec, computed in-process, no network hop
  Sticky cache size (Redis, optional latency optimization):
    20,000,000 entities * ~40 bytes/assignment ~= 800MB, trivially cached

Prediction event volume:
  Prediction events/day: 200,000/sec * 86,400s = 17,280,000,000/day
  Event size (entity_id, experiment_id, variant_id, metric, timestamp): ~150 bytes
  Raw daily volume: 17.28B * 150 bytes ~= 2.6TB/day, ~780GB/day compressed (~30%)
  180-day retention: 780GB * 180 ~= 140TB compressed prediction + outcome log

Outcome event volume:
  Outcome events/day: 17.28B * 0.05 ~= 864,000,000/day, ~130GB/day compressed

Metrics shard throughput:
  3 metrics shards (partitioned by hash(experiment_id)):
  ~200,000 events/sec / 3 ~= 67,000 events/sec sustained write per shard

Statistical engine load:
  50 experiments * ~5 guardrail metrics = 250 metric-tests per window
  Evaluations/sec: 250 / 300s ~= 0.83/sec, negligible compute despite the
  petabyte-scale event log feeding the aggregates it reads
The read-heavy side of this system is the sticky assignment cache, since every one of 200,000 requests a second triggers a cache lookup while writes only happen on a cache miss or a first assignment, so the cache is sized and replicated for read throughput rather than write durability, exactly like the online feature stores this architecture sits beside in a typical ML platform. The one place a hot spot reliably appears is a single viral experiment concentrating disproportionate traffic on one metrics shard when sharding naively by experiment_id alone; mitigate it by sub-sharding any experiment whose traffic exceeds a threshold across experiment_id plus a bucket range, spreading one hot experiment’s load across multiple physical partitions instead of pinning it to one.
Assignment is computed independently in every region, so routing latency never crosses a region boundary, but the statistical significance test always runs against a single global rollup merged across every region’s metrics shards, never a per-region test. Splitting the sample by region would cut statistical power roughly by the number of regions and delay every valid verdict.
Spotify’s and Netflix’s experimentation platforms both report merging metrics globally before running significance tests for exactly this reason. A regionally fragmented sample takes proportionally longer to reach the same statistical confidence a merged global sample reaches, which directly works against the rollback latency SLO this system is built around.
Failure Modes and Recovery
| Failure | Detection | Impact | Recovery |
|---|---|---|---|
| Traffic Router node crash mid-request | Load balancer health check failure | In-flight requests to that node fail | LB removes the node; retries land on a healthy replica and recompute the identical hash, so no consistency is lost since assignment was never cache-dependent |
| Sticky assignment cache (Redis) unavailable | Cache client connection error | Slightly higher latency per request | Router falls back to recomputing the hash directly in-process; correctness is unaffected, only the latency optimization is lost |
| Metrics pipeline consumer lag spike | Consumer lag alarm on the ingestion topic | Guardrail evaluation delayed beyond the 60-second freshness SLO | Autoscale consumer parallelism; Rollback Controller fails closed, freezing any active canary ramp until freshness recovers |
| Statistical engine reads a partial or corrupted aggregation window | Row-count sanity check against expected traffic volume for that window | Risk of a false significance result from an incomplete sample | Window is flagged incomplete and discarded; the engine waits for the next clean window rather than acting on a partial one |
| Rollback Controller itself becomes unavailable | Heartbeat monitor on the controller process | No automatic rollback would fire even if a guardrail truly breaches | A separate watchdog freezes any active ramp-up and pages on-call after missing a small number of consecutive heartbeats, so experiments cannot silently keep expanding a possibly broken model |
| Clock skew between regional router fleets | NTP drift monitor comparing event timestamps against server-observed bounds | 5-minute aggregation windows misalign across regions; the global rollup double counts or drops slices of traffic | Bucket events by server-side ingestion time, not client-reported timestamp; reject and quarantine events with skew beyond tolerance |
The most common operational mistake is disabling the Rollback Controller during a high-visibility launch “to avoid noisy false alarms” and forgetting to re-enable it afterward. The controller is not an optional nicety layered on top of the experiment, it is the only thing standing between a genuinely bad model and tens of millions of requests served with no safety net for however long it stays off.
Comparison of Approaches
| Approach | Latency overhead | Complexity | Failure mode | Best fit |
|---|---|---|---|---|
| Deterministic hash assignment (this design) | Under 1ms, computed in-process | Medium | Shrinking a split mid-experiment breaks stickiness if not treated as a full rollback | High-traffic ML rollouts that need per-user consistent measurement |
| Random per-request assignment | Under 1ms | Low | Cannot attribute any downstream outcome to a specific variant, unusable for measurement | Pure load balancing across identical replicas, never for a controlled experiment |
| Third-party feature-flagging service (percentage rollout) | 5-20ms network hop to a managed service | Low, mostly managed | Vendor outage blocks assignment decisions; less control over the hashing algorithm’s independence guarantees | Product or UI experiments where ML-grade routing latency is not required |
| Shadow-only evaluation, then a single full cutover | None added to the served path | Medium | No real user reaction signal until 100% cutover; a regression is found only after full exposure | Early validation before any experiment; not sufficient alone for measuring a business-metric rollout |
| Centralized synchronous assignment service (network call per request) | 5-15ms round trip per request | Medium to High | Single point of failure and added tail latency on every request | Only when assignment logic is too complex to compute inline, such as a live-updating multi-armed bandit |
For a system serving 200,000 requests a second, in-process deterministic hash assignment is the right default, it is the only option here that adds effectively zero latency while guaranteeing the exact stickiness the statistical engine’s attribution depends on. A centralized assignment service is worth revisiting only once the assignment logic itself needs live state a pure function cannot express, such as a bandit that reallocates traffic based on running performance; a third-party flagging service is worth revisiting for lower-stakes, non-ML rollouts where a shared platform’s convenience outweighs the latency and independence tradeoffs.
Key Takeaways
- The registry is the single source of truth for what is allowed to serve traffic: no router should ever resolve a model version by convention or file path, only through an explicit, versioned registry lookup.
- Deterministic hashing, not per-request randomness, is what makes measurement possible: a
model registryand metrics pipeline are worthless if the same user can land in both arms of an experiment across two consecutive requests. - Monotonic bucket assignment is what makes a canary ramp safe: giving the challenger the numerically lowest buckets means growing its split only ever adds entities, it never reassigns someone already being measured.
- Shadow mode catches integration bugs that offline evaluation cannot: mirroring real traffic without serving the response finds serialization mismatches and latency regressions before a single real user is ever exposed to them.
- Attribution correctness depends on denormalizing the variant onto every event: a metric event must carry the assignment that was active when it happened, never one re-derived from a live table when the outcome arrives later.
- Statistical significance testing must tolerate continuous monitoring: a fixed-horizon p-value checked repeatedly is not a valid 1% test anymore; an always-valid sequential test is what makes checking a dashboard all day long safe.
- Automatic rollback needs a confirmation gate, not just a significance gate: acting on the first breached window alone guarantees frequent false rollbacks purely from the number of simultaneous tests running across dozens of experiments.
- A single breached guardrail should be sufficient to roll back, not a consensus across all metrics: a challenger that improves one metric while quietly regressing a more important one is still a regression.
The counter-intuitive lesson is that the hardest part of this system is not the traffic-splitting infrastructure, deterministic hashing is a well-understood, almost mechanical problem. It is resisting the urge to act on the first statistically significant result a dashboard shows, because the same rigor that makes a rollback trustworthy, minimum sample sizes, always-valid sequential tests, consecutive-window confirmation, is exactly the rigor that makes the system feel slower than an engineer’s gut instinct in the moment, right up until the gut instinct is wrong and the automation was correct to wait.
Frequently Asked Questions
Q: Why not use a third-party feature-flagging service instead of building a custom traffic router?
A: A managed flagging service is a reasonable choice for product or UI experiments, but it adds a network hop of 5 to 20 milliseconds per request and gives up control over how the hashing algorithm guarantees independence across concurrent experiments. At 200,000 requests a second with a 1ms routing latency budget, computing the assignment in-process is the only option that reliably clears the bar, and ML rollouts specifically need that tight latency coupling to the inference path a general-purpose flagging tool was not built for.
Q: Why not just average metrics across all users, control versus challenger, instead of running continuous statistical significance testing?
A: A raw average comparison cannot distinguish a real regression from ordinary sampling variance, especially early in a canary when the challenger has a small sample. Without a significance test, a team either reacts to noise constantly, rolling back challengers that were actually fine, or waits so long for confidence that a genuinely bad model keeps serving degraded predictions far longer than necessary.
Q: Why bother with shadow mode if the plan is to canary at 1% live traffic anyway?
A: Shadow mode catches an entire class of bugs, crashes, timeouts, malformed outputs, integration mismatches with the feature pipeline, before any real user is exposed to them at all, whereas even a 1% canary still serves a live prediction to real users the moment it starts. Shadow mode is strictly cheaper in risk than the smallest possible canary, at the cost of roughly doubling inference compute for the traffic fraction being mirrored.
Q: Why require confirmation across consecutive windows instead of rolling back at the first statistically significant result?
A: With 50 concurrent experiments each testing several guardrail metrics every 5 minutes, even a well-calibrated 1% false-positive rate per test produces several spurious single-window breaches a day purely from the volume of tests running. Requiring the breach to persist across two or more consecutive windows filters out that noise while adding only a few minutes of delay to a genuine, persistent regression.
Q: How does the system avoid misattributing a delayed outcome, like a purchase that happens after the user’s app updates and gets reassigned?
A: Every metric event, prediction or outcome, is stamped with the variant_id that was active at the moment the event was recorded, not re-derived by joining against the current assignment table later. Even if the entity’s live assignment later changes for a different experiment, the historical event keeps pointing at the variant that actually produced the original prediction.
Q: Why not use a multi-armed bandit that dynamically shifts traffic toward the better-performing variant, instead of a fixed canary ramp schedule?
A: A bandit optimizes for cumulative reward during the experiment itself, which is attractive, but it actively complicates the statistical guarantees this system depends on, since traffic allocation changing in response to the very metric being measured breaks the independence assumptions most significance tests rely on. A fixed, pre-declared ramp schedule with an always-valid sequential test is simpler to reason about and audit for a safety-critical rollout, even though it leaves some traffic-efficiency on the table compared to an adaptive bandit.
Interview Questions
Q: Design the traffic routing layer for an ML A/B testing system that must add no more than 1ms of latency and keep the same user consistently assigned to the same model variant for the life of an experiment.
Expected depth: Discuss deterministic hashing of entity id plus an experiment-specific salt into a bounded bucket space, why per-request random assignment breaks attribution, computing the assignment in-process versus a centralized assignment service, and using a cache purely as a latency optimization rather than a source of truth since the hash function is itself the source of truth.
Q: How would you prevent a team from constantly checking an experiment’s dashboard from inflating the false-positive rate of your significance tests?
Expected depth: Discuss the difference between a fixed-horizon p-value and an always-valid sequential test such as mixture SPRT, why continuous monitoring of a naive t-test is equivalent to the classic “peeking problem” or optional stopping, and how an always-valid confidence sequence lets a test be checked at any time without adjusting alpha.
Q: Walk through how you would design the automatic rollback logic so it reacts quickly to real regressions but does not flap on noisy metrics.
Expected depth: Discuss a minimum sample size gate before any test is evaluated, a statistical significance gate at a chosen alpha, and a consecutive-window confirmation gate that resets on any clean window, plus why requiring only one breached guardrail (not a consensus across all guardrails) to trigger rollback is the correct default.
Q: A canary experiment ramps from 1% to 50% of traffic over several stages. How do you guarantee a user assigned to the challenger at 1% stays assigned to the challenger as the split grows to 50%?
Expected depth: Discuss giving the challenger the numerically lowest hash buckets so raising the split boundary only ever adds new entities to its range, why shrinking a split mid-experiment must be treated as a full rollback rather than a partial change to preserve monotonicity, and the tradeoffs of that design against a scheme that reshuffles assignments on every split change.
Q: How would you scale this system’s metrics pipeline and statistical testing across multiple geographic regions without weakening the statistical guarantees?
Expected depth: Discuss regional sharding for assignment and ingestion latency versus always merging metrics into a single global rollup before running any significance test, why testing per-region instead would cut statistical power roughly by the number of regions, and how to handle clock skew and hot-shard mitigation when one experiment’s traffic disproportionately concentrates on a single metrics shard.
Premium Content
Unlock the full article along with everything else in the archive — all in one place.