Build a Customer Churn Classifier with Gradient Boosted Trees
classical-ml feature-engineering model-evaluation
ML Problem & Solution
Churn Prediction with Gradient Boosted Trees
Churn is rare, labels arrive late, and the model that scores best is not the one that saves the most users.
A subscription business with 1.8 million active subscribers loses about 4.1% of them every 30 days. The retention team has budget to send a targeted save offer to roughly 5% of the base each month, which works out to 90,000 users. Their current targeting rule is “anyone who has not opened the app in 14 days”, and it is wasting most of that budget on people who were never going to leave while missing the ones who quietly stopped finding value weeks earlier.
The ask sounds simple: give each subscriber a number between 0 and 1 representing how likely they are to cancel in the next 30 days, so the team can spend the offer budget on the 90,000 highest-risk users instead of the 90,000 most dormant ones. Dormancy and churn risk overlap, but they are not the same thing, and the gap between them is where the money is.
Think of it like triage in an emergency room. The loudest patient is not the sickest one. A good triage nurse is not ranking by how obvious the distress signal is, they are ranking by probability of deterioration in the next few hours given everything on the chart. A churn model has the same job: rank by risk, not by how visible the symptom is.
The naive approach has two failure modes that both look like success. First, a majority-class classifier that predicts “will not churn” for everyone scores 95.9% accuracy, which is a number an executive will nod at and which is completely useless. Second, a plain logistic regression on the obvious features (days since last login, plan tier, tenure) gets ROC-AUC around 0.74, which sounds respectable until you look at the top 5% of its scores and find only 28% of the actual churners in there. What makes this genuinely hard is not the model class, it is three structural properties of the problem: the positive class is rare at roughly 1 in 24, the label does not exist until the 30-day window has closed so every training row is a month stale, and the strongest signal lives in rates of change across behavioral time series rather than in any single snapshot column.
Given a subscriber’s account attributes and a 60-day window of behavioral event aggregates observed at time T, predict whether that subscriber will cancel between T and T + 30 days, optimizing for PR-AUC and recall in the top 5% of scores, under a 20ms per-user scoring budget and a requirement that every score come with a human-readable reason.
Framing the Problem
This is a binary classification problem on tabular data, scored in batch nightly and served from a cache. It is deliberately not framed as survival analysis (time-to-churn) even though the underlying process is a time-to-event process, because the retention campaign runs on a fixed monthly cadence and only ever needs the answer to one question: will this person be gone by next month.
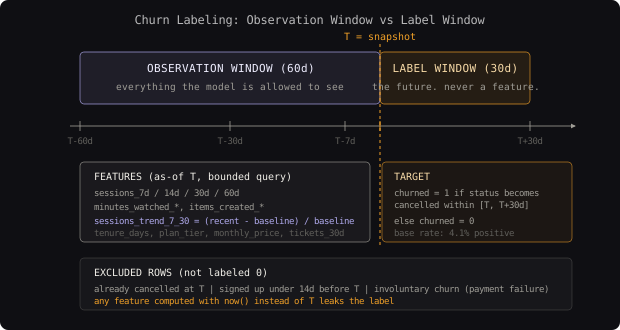
The target definition is where most churn projects quietly go wrong, so state it precisely:
churned = 1if the subscription moves tocancelledorexpiredstate with a timestamp in the 30 days after the snapshot dateTchurned = 0if the subscription is stillactiveatT + 30 days- Rows where the subscriber is already cancelled at
Tare excluded entirely, not labeled 0 - Rows where the subscriber signed up fewer than 14 days before
Tare excluded, because their feature window is too short to be comparable - Involuntary churn (payment failure, expired card) gets its own label and is excluded from this model, because the intervention is a dunning email, not a discount offer
That last exclusion matters more than it looks. Involuntary churn is about 1.3 percentage points of the 4.1% total, and it is highly predictable from payment metadata. Leaving it in inflates every metric while training the model to find expired credit cards rather than disengaged humans.
Constraints:
- Scoring latency under 20ms per user at p99, since the same model also backs an on-demand score in the support agent console
- Model must expose per-prediction reasons, because agents need to know why a user was flagged before offering a discount
- Training data is 2.4 million subscriber-snapshot rows spanning 24 months, roughly 60 features after aggregation
- Label lag is 30 days by construction, so the freshest usable training label is always a month old
- No PII beyond hashed account identifiers in the feature store
The success metric is PR-AUC, with recall@5% as the campaign-aligned operating metric. Guardrail metrics are calibration error (Brier score) and score stability month over month, neither of which may regress when PR-AUC improves.
PR-AUC over ROC-AUC. At a 4.1% base rate, ROC-AUC is dominated by how well the model ranks the 95.9% of easy negatives, so a model can gain 0.05 ROC-AUC while getting worse at the only thing that matters: who lands in the top 5% of scores.
Out of scope: the uplift modeling question of whether the offer actually changes behavior (that needs a randomized holdout and a different target), and real-time streaming features computed at request time.
A churn model's real output is a ranking, not a probability, because the budget is fixed at 5% of the base. Optimizing for a good probability estimate and optimizing for a good ordering are different objectives, and you need both only if a downstream system multiplies the score by a dollar value.
Data and Features
Three sources get joined at snapshot time. The subscription table gives plan tier, price, tenure, billing period, and discount history. The event stream gives per-user daily aggregates of sessions, minutes watched, items created, searches, and feature touches. The support system gives ticket counts and last contact reason.
The feature set is built as aggregates over trailing windows relative to T, never over the full history, because a 3-year-old user and a 3-month-old user need comparable columns. The windows are 7, 14, 30, and 60 days, and the highest-signal features are the ratios between windows.
# Feature engineering: trailing-window aggregates plus the ratio features that carry the signal
import pandas as pd
import numpy as np

WINDOWS = [7, 14, 30, 60]
ACTIVITY_COLS = ["sessions", "minutes_watched", "items_created", "searches"]


def build_window_features(events: pd.DataFrame, snapshot_date: pd.Timestamp) -> pd.DataFrame:
    """Aggregate per-user daily events into trailing-window sums ending at snapshot_date."""
    frames = []
    for window in WINDOWS:
        start = snapshot_date - pd.Timedelta(days=window)
        mask = (events["event_date"] > start) & (events["event_date"] <= snapshot_date)
        agg = (
            events.loc[mask]
            .groupby("user_id")[ACTIVITY_COLS]
            .sum()
            .add_suffix(f"_{window}d")
        )
        frames.append(agg)
    return pd.concat(frames, axis=1).fillna(0.0)


def add_trend_features(features: pd.DataFrame) -> pd.DataFrame:
    """Ratio of recent activity to longer-baseline activity. This is where the signal lives."""
    out = features.copy()
    for col in ACTIVITY_COLS:
        recent = out[f"{col}_7d"]
        baseline = out[f"{col}_30d"] / 30.0 * 7.0  # 30d rate rescaled to a 7d expectation
        out[f"{col}_trend_7_30"] = (recent - baseline) / (baseline + 1.0)
        out[f"{col}_zero_streak"] = (recent == 0).astype(int)
    out["engagement_decay"] = out["sessions_trend_7_30"] * out["minutes_watched_trend_7_30"]
    return out
Premium Content
Unlock the full article along with everything else in the archive — all in one place.