Build an LLM Inference Gateway with Load Balancing Across Model Replicas
performance scalability caching
AI System Design Deep Dive
LLM Inference Gateway
Round robin is the wrong load balancer when every request holds GPU memory hostage for eight seconds.
A stateless HTTP service is easy to load balance because every request is roughly identical and finishes in milliseconds. An LLM replica is the opposite. One request arrives with 200 prompt tokens and asks for 30 output tokens. The next arrives with 32,000 prompt tokens and asks for 4,000. The first costs 40ms of GPU time. The second occupies a slice of GPU memory for two full minutes and will not release it until the last token is sampled. Round robin treats both as one unit of work, and that arithmetic error is what turns a healthy fleet into a fleet where half the GPUs idle while the other half return 503s.
Think of a restaurant expediter rather than a turnstile. A turnstile counts bodies. An expediter looks at what is already on each burner, how long each dish takes, and whether the sauce for the new order is already reduced and sitting in a pan. That last part matters more than anything in LLM serving, because a replica that already holds the KV cache blocks for a 3,000 token system prompt can start generating in 40ms while a cold replica needs 600ms to recompute the same attention keys and values.
Here is the target. We are fronting 64 GPU replicas across three model pools: 16 replicas of a 70B model with tensor parallelism across 2 A100 80GB cards each, 40 replicas of an 8B model on single cards, and 8 replicas hosting roughly 60 LoRA adapters for enterprise tenants. Traffic is 5,000 requests per second at peak, averaging 1,800 input tokens and 300 output tokens. The SLA is 400ms time-to-first-token (TTFT) at p99 and 50ms time-per-output-token (TPOT) at p95. The fleet costs roughly $2,600 per hour on demand, so a 20 percent utilization gap is $12.5 million a year of GPUs doing nothing.
A naive gateway fails in four specific ways. It sends a 32k-token prompt to a replica whose KV cache is at 95 percent, which forces the engine to preempt and swap out three in-flight sequences, spiking their TPOT from 24ms to 400ms. It uses least-connections, which looks correct until you notice one connection can mean 30 tokens or 4,000 tokens of remaining work. It buffers streaming responses, which destroys TTFT as a user-visible metric even when the GPU produced the first token on time. And it keeps a queued request alive after the client has already hung up, burning GPU seconds on output nobody will read. We need to solve for load signals that reflect GPU memory rather than request counts, cache affinity that survives fleet churn, and admission control that sheds work before the GPU is oversubscribed, all simultaneously.
Requirements and Constraints
Functional Requirements
- Accept OpenAI-compatible requests on
POST /v1/chat/completionsandPOST /v1/completions, withstream=trueandstream=falseboth supported - Route each request to a replica in the correct model pool, resolving aliases such as
gpt-fastto a concrete pool - Support LoRA adapter selection per request, routing to hosts that already have the adapter resident
- Stream tokens back as Server-Sent Events with per-delta flush and no buffering
- Propagate client cancellation to the replica so the engine aborts the sequence and frees KV blocks
- Enforce per-tenant token quotas and concurrency limits before the request touches a GPU
- Retry idempotently on replica failure, but only before the first token has been emitted
- Emit a usage record per request with input, output, and cache-hit token counts for billing and attribution
Non-Functional Requirements
TTFTp50 under 180ms, p99 under 400ms for prompts up to 4,000 tokensTPOTp95 under 50ms so a 300 token answer completes in under 15 seconds- Gateway overhead itself under 10ms p99, excluding time spent waiting on a GPU
- Throughput of 5,000 requests per second and 1.5 million output tokens per minute
- GPU utilization above 75 percent measured as KV cache block occupancy, not
nvidia-smipercent - Availability of 99.95 percent for the gateway tier, which must survive losing any single replica without user-visible errors
- Cost under $9 per million output tokens for the 70B pool and under $0.80 for the 8B pool
- Cancellation latency under 100ms from client disconnect to KV block release
Constraints
- Replicas run
vllmwithPagedAttentionand continuous batching enabled. We do not modify the engine, we only steer traffic into it. - Hardware is A100 80GB. The 70B model in FP16 needs 140 GB of weights, so it cannot fit on one card and tensor parallelism degree 2 is the minimum replica size.
- Model weights are pinned per replica. We are not swapping base models at request time, only LoRA adapters.
- Out of scope: training, fine-tuning, speculative decoding inside the engine, and multi-region failover. We assume one region with three availability zones.
High-Level Architecture
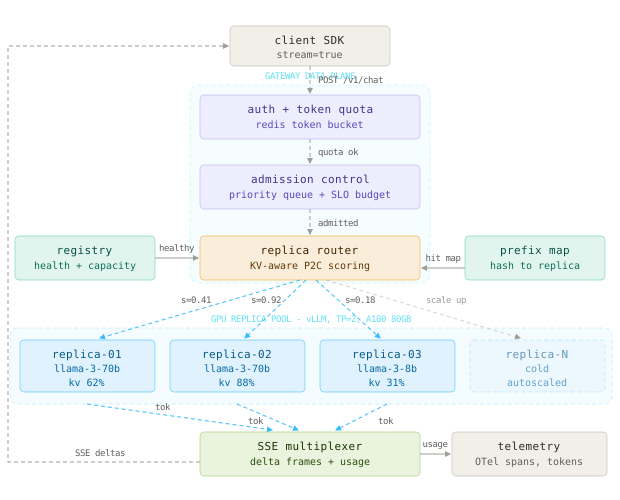
Six components carry the whole design. The auth and quota layer validates the API key and decrements a token bucket in Redis, rejecting over-budget tenants in about 2ms. The admission controller decides whether the fleet has room for this request at all, and if not, whether to queue it or shed it immediately with a 429 and a Retry-After header. The replica router is the heart of the system: it scores candidate replicas on KV cache pressure, pending prefill work, and prefix cache overlap, then picks a winner. The replica registry tracks which replicas are alive, which model and adapters they host, and how much KV headroom each has. The prefix cache map records which replica most recently held the KV blocks for a given prompt prefix hash. The SSE multiplexer owns the client connection, forwards each token delta the moment it arrives, and writes the usage record when the stream terminates.
A request flows like this. The client opens a connection and sends a chat completion with stream=true. Auth resolves the tenant, checks the token bucket, and attaches a deadline derived from the request’s max_tokens and the tenant’s SLA tier. The gateway tokenizes the prompt locally with the same tokenizer the model uses, which costs about 4ms for 1,800 tokens and gives us two things we cannot get otherwise: an exact token count for quota math, and a rolling hash of the prompt prefix in 16-token blocks for cache affinity. The router looks up the prefix hash, finds that replica-03 served a request with the same 1,500-token system prompt 90 seconds ago, checks that replica-03 still has KV headroom, and dispatches there.
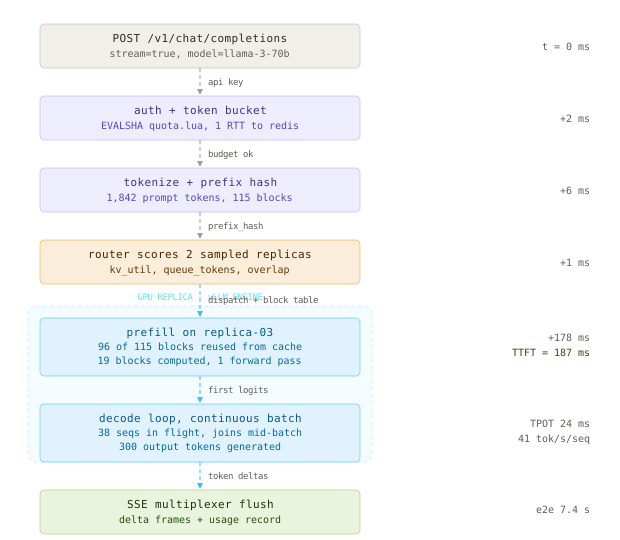
On the replica, vllm recognizes 96 of the 115 prompt blocks as already resident in its prefix cache, computes only the 19 new blocks, and emits the first token in 178ms instead of the 610ms a cold prefill would take. The sequence joins the running decode batch mid-flight. Every sampled token flows back over the open HTTP connection to the multiplexer, which writes it to the client as a data: frame and flushes. When the engine emits the stop reason, the multiplexer closes the stream, writes a usage_record, and updates the prefix map so the next request with that system prompt lands on the same replica.
The routing decision is not about balancing load evenly. It is about maximizing KV cache reuse subject to a memory pressure ceiling, because a cache hit is worth 3x more latency than perfect balance is worth.
The Token Budget and Admission Layer
This component’s job is to make sure no request reaches a GPU unless the fleet can finish it inside the caller’s deadline and the caller has the budget to pay for it.
A smart engineer’s first instinct is to rate limit on requests per second. That fails immediately in LLM serving because requests are not comparable. A tenant sending 100 requests per second with 50-token prompts uses less GPU than a tenant sending 3 requests per second with 30,000-token prompts. Rate limiting on requests lets the second tenant consume 20x their fair share while looking well behaved on the dashboard.
We limit on tokens, and we limit twice: a token bucket for sustained throughput and a concurrency semaphore for instantaneous GPU footprint. The token bucket refills at the tenant’s contracted rate. The semaphore caps how many sequences a tenant can have in flight, which is what actually bounds their KV cache consumption.
-- Atomic token bucket plus concurrency check for one LLM request. EVALSHA this.
-- KEYS[1] = tenant token bucket, KEYS[2] = tenant in-flight counter
-- ARGV: refill_rate_tps, burst_capacity, cost_tokens, max_inflight, now_ms, ttl_s
local bucket = redis.call('HMGET', KEYS[1], 'tokens', 'ts')
local tokens = tonumber(bucket[1])
local ts = tonumber(bucket[2])
local rate = tonumber(ARGV[1])
local burst = tonumber(ARGV[2])
local cost = tonumber(ARGV[3])
local max_inflight = tonumber(ARGV[4])
local now = tonumber(ARGV[5])
if tokens == nil then
tokens = burst
ts = now
end
-- refill based on elapsed wall time, clamped at burst capacity
local elapsed = math.max(0, now - ts) / 1000.0
tokens = math.min(burst, tokens + elapsed * rate)
if tokens < cost then
local deficit = cost - tokens
local retry_after = math.ceil(deficit / rate)
return {0, 'quota', retry_after}
end
local inflight = tonumber(redis.call('GET', KEYS[2]) or '0')
if inflight >= max_inflight then
return {0, 'concurrency', 1}
end
tokens = tokens - cost
redis.call('HSET', KEYS[1], 'tokens', tokens, 'ts', now)
redis.call('EXPIRE', KEYS[1], tonumber(ARGV[6]))
redis.call('INCR', KEYS[2])
redis.call('EXPIRE', KEYS[2], 300)
return {1, 'ok', 0}
The cost we charge is input_tokens + max_tokens, a pessimistic reservation. When the stream ends we refund the difference between max_tokens and the actual output count. Without the reservation, a tenant can open 500 streams that each declare max_tokens: 8000 and pass the quota check while committing 4 million tokens of future work.
Admission control sits after quota and answers a different question: does the fleet have room right now. We compute a fleet-wide queue budget in token units, which is the sum of free KV blocks across healthy replicas in the target pool multiplied by block size, minus the tokens already reserved by queued requests.
# Fleet-level admission decision using KV headroom rather than request counts.
import time
from dataclasses import dataclass
BLOCK_SIZE = 16 # tokens per PagedAttention block, must match vllm --block-size
@dataclass
class ReplicaState:
replica_id: str
total_blocks: int
used_blocks: int
queue_tokens: int # pending prefill tokens not yet started
decode_tps: float # measured tokens/sec/seq on this replica
healthy: bool
updated_ms: int
def free_tokens(r: ReplicaState) -> int:
return max(0, (r.total_blocks - r.used_blocks) * BLOCK_SIZE)
class AdmissionController:
def __init__(self, headroom_ratio: float = 0.15, stale_ms: int = 5000):
# keep 15% of KV free so continuous batching never has to preempt
self.headroom_ratio = headroom_ratio
self.stale_ms = stale_ms
def admit(self, pool: list[ReplicaState], need_tokens: int,
queued_tokens: int, deadline_ms: int) -> tuple[bool, str, int]:
now = int(time.time() * 1000)
live = [r for r in pool if r.healthy and now - r.updated_ms < self.stale_ms]
if not live:
return False, "no_healthy_replica", 5
capacity = sum(free_tokens(r) for r in live)
reserve = int(sum(r.total_blocks * BLOCK_SIZE for r in live) * self.headroom_ratio)
available = capacity - reserve - queued_tokens
if need_tokens > available:
# estimate drain time from slowest observed decode rate
slowest = min((r.decode_tps for r in live), default=1.0)
wait_ms = int((need_tokens - available) / max(slowest, 1.0) * 1000)
if wait_ms > deadline_ms:
return False, "deadline_exceeded", max(1, wait_ms // 1000)
return True, "queued", wait_ms
return True, "admitted", 0
The headroom_ratio is the parameter people get wrong. Set it to zero and you maximize throughput on paper, but the engine starts preempting sequences: vllm swaps a running sequence’s KV blocks to CPU memory, and when it swaps back the sequence’s TPOT jumps by an order of magnitude. Set it to 0.4 and you leave 32 GB of A100 memory unused on every card. We landed on 0.15 by measuring preemption count against block occupancy and taking the knee of the curve.
Queueing at the gateway with no deadline check produces the worst possible failure: requests that wait 30 seconds, reach a GPU, generate 4,000 tokens, and stream into a socket the client abandoned 25 seconds ago. Always carry a deadline and drop work that can no longer land in time.
The Replica Router
This component’s job is to pick the one replica that will produce the first token soonest without pushing that replica into memory preemption.
The signals that matter are not the signals a standard load balancer collects. Connection count is nearly useless. Latency of the last request is misleading, because a replica that just served a 50-token request looks fast while holding 60 GB of KV cache for eight long-running sequences. The three signals that predict TTFT are KV cache utilization, pending prefill tokens, and prefix overlap.
KV cache utilization is the fraction of PagedAttention blocks in use. It is the real capacity signal because it is the resource that runs out first. Pending prefill tokens measure the work sitting in the engine’s waiting queue: prefill is compute bound and serialized against decode steps, so a replica with 20,000 queued prefill tokens will stall your first token behind roughly 400ms of other people’s matrix multiplies. Prefix overlap is how many of your prompt’s blocks the replica already holds.
# Scores replicas for TTFT, then picks with power-of-two-choices to avoid herding.
import random
import time
class Router:
W_KV = 0.5 # weight on memory pressure
W_QUEUE = 0.3 # weight on pending prefill work
W_OVERLAP = 0.4 # credit for cache hits, subtracted from score
QUEUE_NORM = 20000 # tokens of queued prefill that count as "fully loaded"
def __init__(self, registry, prefix_map, stale_ms: int = 5000):
self.registry = registry
self.prefix_map = prefix_map
self.stale_ms = stale_ms
def score(self, r: ReplicaState, block_hashes: list[int], now: int) -> float:
kv = r.used_blocks / max(1, r.total_blocks)
qnorm = min(1.0, r.queue_tokens / self.QUEUE_NORM)
overlap = self.prefix_map.overlap_ratio(r.replica_id, block_hashes)
s = self.W_KV * kv + self.W_QUEUE * qnorm - self.W_OVERLAP * overlap
# a stale signal is a lie; decay unknown replicas toward "loaded"
age = now - r.updated_ms
if age > self.stale_ms // 2:
decay = min(1.0, (age - self.stale_ms / 2) / (self.stale_ms / 2))
s = s * (1 - decay) + 1.0 * decay
return s
def pick(self, model: str, adapter: str | None,
block_hashes: list[int], need_tokens: int) -> ReplicaState | None:
now = int(time.time() * 1000)
cands = [
r for r in self.registry.for_model(model, adapter)
if r.healthy
and now - r.updated_ms < self.stale_ms
and free_tokens(r) >= need_tokens
]
if not cands:
return None
if len(cands) <= 2:
return min(cands, key=lambda r: self.score(r, block_hashes, now))
# bias the sample toward the cache owner, then P2C over the rest
owner = self.prefix_map.owner(block_hashes)
sample = []
if owner:
hit = next((r for r in cands if r.replica_id == owner), None)
if hit is not None:
sample.append(hit)
while len(sample) < 2:
pick = random.choice(cands)
if pick not in sample:
sample.append(pick)
return min(sample, key=lambda r: self.score(r, block_hashes, now))
Two design decisions in that code deserve explanation. First, power of two choices instead of global minimum. Sampling two replicas and taking the better one gives you load distribution within a small constant factor of optimal, but more importantly it avoids the thundering herd that global-minimum routing creates. With 12 gateway pods all reading the same load table refreshed every 250ms, global minimum sends every request in that window to the same replica, which then becomes the most loaded replica, and the fleet oscillates. Sampling breaks the correlation.
Second, stale signals decay toward loaded. If a replica has not reported in 3 seconds we do not treat its last known 20 percent utilization as truth. A replica that stopped reporting is more likely overloaded or dying than idle. Optimism about stale data is how you funnel traffic into a replica that is already in trouble.
This is the pattern the vLLM production stack and Ray Serve both converged on: the router reads vllm:num_requests_waiting and vllm:gpu_cache_usage_perc from each engine’s /metrics endpoint and routes on cache pressure. NVIDIA’s Triton and the newer Dynamo router add KV-aware and prefix-aware scoring on top of the same two signals.
The Prefix Cache Map
This component’s job is to remember which replica last held the KV blocks for a given prompt prefix so we can route repeat traffic back to it.
Prefix caching is a hotel keeping your room made up between visits. If you return to the same hotel, you walk straight in. If you switch hotels, someone has to make the bed from scratch. The bed here is the attention keys and values for every token in your system prompt, and making it costs a full forward pass over those tokens.
Production traffic is dominated by shared prefixes. A RAG application sends the same 1,200-token system prompt on every call. An agent loop resends the entire conversation plus tool schemas on every step, so turn 7 shares 95 percent of its tokens with turn 6. Measured on real traffic, prefix hit rates of 60 to 85 percent are normal once routing is affinity aware, and each hit removes the prefill cost for the shared portion.
# Rolling block-level hash chain for prefix cache affinity. Mirrors vllm's scheme.
import hashlib
import struct
BLOCK_SIZE = 16
def block_hashes(token_ids: list[int], lora_id: str = "") -> list[int]:
"""Chained hash per 16-token block. Block i's hash covers tokens 0..i*16,
so a shared prefix produces identical leading hashes across requests."""
hashes: list[int] = []
parent = hashlib.blake2b(lora_id.encode(), digest_size=8).digest()
for start in range(0, len(token_ids) - BLOCK_SIZE + 1, BLOCK_SIZE):
block = token_ids[start:start + BLOCK_SIZE]
h = hashlib.blake2b(digest_size=8)
h.update(parent)
h.update(struct.pack(f"<{len(block)}i", *block))
parent = h.digest()
hashes.append(struct.unpack("<Q", parent)[0])
return hashes # trailing partial block is never cached
The map itself is a Redis hash from block hash to replica id with a short TTL, written by the gateway after a successful dispatch. We only track the longest prefix we care about, capped at 64 blocks or 1,024 tokens, because beyond that the marginal cache hit is small and the key cardinality explodes.
# Prefix owner lookup: longest matching prefix wins, bounded by cardinality cap.
MAX_TRACKED_BLOCKS = 64
class PrefixMap:
def __init__(self, redis_client, ttl_s: int = 180):
self.r = redis_client
self.ttl = ttl_s
def owner(self, hashes: list[int]) -> str | None:
probe = hashes[:MAX_TRACKED_BLOCKS]
if not probe:
return None
# walk from longest to shortest, first hit is the deepest cache match
keys = [f"pfx:{h}" for h in reversed(probe)]
vals = self.r.mget(keys)
for v in vals:
if v:
return v.decode()
return None
def overlap_ratio(self, replica_id: str, hashes: list[int]) -> float:
probe = hashes[:MAX_TRACKED_BLOCKS]
if not probe:
return 0.0
vals = self.r.mget([f"pfx:{h}" for h in probe])
matched = 0
for v in vals:
if v and v.decode() == replica_id:
matched += 1
else:
break # prefix property: stop at the first miss
return matched / len(probe)
def record(self, replica_id: str, hashes: list[int]) -> None:
probe = hashes[:MAX_TRACKED_BLOCKS]
if not probe:
return
pipe = self.r.pipeline(transaction=False)
for h in probe:
pipe.set(f"pfx:{h}", replica_id, ex=self.ttl)
pipe.execute()
Simplify this by pinning tenants to replicas with consistent hashing and you break in two ways. Hot tenants overwhelm their assigned replica with no escape valve, and multi-tenant prefix sharing disappears: two tenants using the same public system prompt no longer share cache blocks. The affinity-with-spill design keeps the cache benefit while letting the router override affinity whenever the owner is above 80 percent KV utilization. That is bounded load consistent hashing, and the bound is what prevents affinity from becoming a hotspot generator.
Never include the LoRA adapter id or sampling parameters in the routed prompt but omit them from the hash. Two requests with identical tokens and different adapters have completely different KV values. Mixing them means the engine either recomputes silently or, with a buggy engine build, serves attention state from the wrong adapter.
The Streaming Multiplexer
This component’s job is to hold the client socket, forward every token the instant it is produced, and guarantee that a dead client stops costing GPU time.
The non-obvious part is that most gateway frameworks buffer by default and quietly destroy your TTFT. Reverse proxies with response buffering on, gzip middleware that waits for a full block, and HTTP client libraries that read in 8 KB chunks all add hundreds of milliseconds that never show up in the engine’s own metrics. Your GPU dashboard says TTFT is 190ms. Your users see 700ms.
# SSE proxy with per-delta flush, cancellation propagation, and usage accounting.
import asyncio
import json
import time
import httpx
from fastapi import APIRouter, Request
from fastapi.responses import StreamingResponse
router = APIRouter()
LIMITS = httpx.Limits(max_keepalive_connections=512, max_connections=2048)
client = httpx.AsyncClient(timeout=httpx.Timeout(connect=1.0, read=300.0,
write=5.0, pool=2.0),
limits=LIMITS, http2=False)
@router.post("/v1/chat/completions")
async def chat(req: Request, body: dict):
ctx = await admit_and_route(body) # quota, tokenize, score, pick replica
upstream = f"http://{ctx.replica.host}:8000/v1/chat/completions"
started = time.perf_counter()
async def gen():
ttft_ms = None
out_tokens = 0
stop_reason = "error"
try:
async with client.stream("POST", upstream, json=body,
headers={"x-request-id": ctx.request_id}) as resp:
if resp.status_code >= 500:
raise UpstreamError(resp.status_code)
async for line in resp.aiter_lines():
if not line:
continue
if await req.is_disconnected():
stop_reason = "client_abort"
break
if ttft_ms is None:
ttft_ms = (time.perf_counter() - started) * 1000
METRICS.ttft.observe(ttft_ms, {"pool": ctx.pool})
if line == "data: [DONE]":
stop_reason = "stop"
yield "data: [DONE]\n\n"
break
out_tokens += 1
yield f"{line}\n\n" # one flush per delta, no batching
except (httpx.ReadError, UpstreamError):
if out_tokens == 0:
# safe to retry: client has seen nothing yet
async for chunk in retry_once(body, ctx):
yield chunk
return
stop_reason = "upstream_drop"
yield 'data: {"error":"stream_interrupted"}\n\n'
finally:
# aborting the upstream request is what actually frees KV blocks
await ctx.release(out_tokens=out_tokens, ttft_ms=ttft_ms,
stop_reason=stop_reason)
return StreamingResponse(gen(), media_type="text/event-stream",
headers={"cache-control": "no-cache",
"x-accel-buffering": "no"})
Three details in that handler are load-bearing. x-accel-buffering: no tells nginx and most ingress controllers not to buffer, which is a one-header fix for a 300ms regression. The disconnect check inside the loop, combined with closing the upstream context, is what propagates cancellation: vllm sees the HTTP connection drop, aborts the sequence, and returns its KV blocks to the free pool within about 50ms. Retry is allowed only when out_tokens is zero, because once a client has seen partial output you cannot restart without producing a duplicated or contradictory answer.
Cancellation is a capacity feature, not a hygiene feature. On agent traffic where 15 percent of requests get abandoned mid-stream, propagating aborts returned about 11 percent of KV capacity to the fleet, which is worth more than any routing tweak.
Data Model
Three storage tiers hold different things at different lifetimes: Redis for the hot routing state that must be readable in under a millisecond, Postgres for the durable metadata and billing records, and the engine’s own GPU memory for the KV blocks we are trying to steer traffic toward.
-- Durable control plane and billing schema for the inference gateway.
CREATE TABLE model_pool (
pool_id TEXT PRIMARY KEY,
model_name TEXT NOT NULL,
revision TEXT NOT NULL,
tp_degree SMALLINT NOT NULL CHECK (tp_degree BETWEEN 1 AND 8),
dtype TEXT NOT NULL DEFAULT 'bfloat16',
max_model_len INTEGER NOT NULL,
block_size SMALLINT NOT NULL DEFAULT 16,
price_in_per_mtok NUMERIC(8,4) NOT NULL,
price_out_per_mtok NUMERIC(8,4) NOT NULL,
created_at TIMESTAMPTZ NOT NULL DEFAULT now(),
UNIQUE (model_name, revision, tp_degree)
);
CREATE TABLE replica (
replica_id TEXT PRIMARY KEY,
pool_id TEXT NOT NULL REFERENCES model_pool(pool_id),
host INET NOT NULL,
port INTEGER NOT NULL CHECK (port BETWEEN 1 AND 65535),
zone TEXT NOT NULL,
gpu_type TEXT NOT NULL,
total_kv_blocks INTEGER NOT NULL,
state TEXT NOT NULL DEFAULT 'loading'
CHECK (state IN ('loading','ready','draining','ejected','dead')),
loaded_adapters TEXT[] NOT NULL DEFAULT '{}',
registered_at TIMESTAMPTZ NOT NULL DEFAULT now(),
last_seen_at TIMESTAMPTZ NOT NULL DEFAULT now(),
UNIQUE (host, port)
);
CREATE INDEX replica_pool_ready_idx ON replica (pool_id, state)
WHERE state IN ('ready','draining');
CREATE INDEX replica_adapters_idx ON replica USING GIN (loaded_adapters);
CREATE TABLE tenant_quota (
tenant_id TEXT PRIMARY KEY,
tier TEXT NOT NULL CHECK (tier IN ('free','pro','enterprise')),
tokens_per_sec INTEGER NOT NULL,
burst_tokens INTEGER NOT NULL,
max_inflight SMALLINT NOT NULL DEFAULT 8,
monthly_cap_usd NUMERIC(10,2),
updated_at TIMESTAMPTZ NOT NULL DEFAULT now()
);
-- Append only, partitioned by day. One row per terminated request.
CREATE TABLE usage_record (
request_id UUID NOT NULL,
tenant_id TEXT NOT NULL,
pool_id TEXT NOT NULL,
replica_id TEXT NOT NULL,
adapter_id TEXT,
input_tokens INTEGER NOT NULL CHECK (input_tokens >= 0),
cached_tokens INTEGER NOT NULL DEFAULT 0,
output_tokens INTEGER NOT NULL CHECK (output_tokens >= 0),
ttft_ms INTEGER,
tpot_ms NUMERIC(8,2),
queue_ms INTEGER NOT NULL DEFAULT 0,
stop_reason TEXT NOT NULL
CHECK (stop_reason IN ('stop','length','client_abort',
'upstream_drop','preempted','error')),
cost_usd NUMERIC(12,6) NOT NULL,
created_at TIMESTAMPTZ NOT NULL,
PRIMARY KEY (created_at, request_id)
) PARTITION BY RANGE (created_at);
CREATE INDEX usage_tenant_day_idx ON usage_record (tenant_id, created_at DESC);
CREATE INDEX usage_replica_idx ON usage_record (replica_id, created_at DESC);
Partitioning usage_record by day on created_at rather than hashing on tenant_id is deliberate. Every query that matters is time bounded: this tenant’s spend this month, this replica’s TTFT distribution in the last hour, yesterday’s cache hit rate by pool. Day partitions make retention a DROP TABLE instead of a DELETE that bloats the heap. The composite primary key puts created_at first so inserts land in the newest partition and stay sequential.
The hot state never touches Postgres. Each replica writes its own load line to Redis every 250ms, and last_seen_at in Postgres is updated lazily once a minute for operator visibility only.
replica:load:{replica_id} HASH, TTL 5s
total_blocks 9216
used_blocks 5714
queue_tokens 3400
running_seqs 38
waiting_seqs 4
decode_tps 41.2
adapters "fin-v3,legal-v1"
updated_ms 1785312004221
pfx:{block_hash} STRING -> replica_id, TTL 180s
inflight:{tenant_id} INTEGER, TTL 300s
bucket:{tenant_id} HASH (tokens, ts), TTL 3600s
Both vLLM’s production router and the Kubernetes Gateway API Inference Extension push replica metrics on a sub-second cadence rather than having the router scrape on demand. The reason is head-of-line blocking: a scrape that has to wait on a busy engine’s event loop returns data that is already stale by the time the routing decision is made.
Key Algorithms and Protocols
Four algorithms carry the routing behavior, and each one exists because a simpler alternative fails at this scale.
Continuous batching and why queue depth lies
Continuous batching is a bus that lets passengers board and exit at any stop instead of waiting for a full load. Static batching waits for N requests, runs them in lockstep, and finishes when the slowest one does, so a 30-token answer sits idle for 4,000 steps waiting on its batch mates. Continuous batching runs one decode step over all active sequences, evicts finished ones, and admits waiting ones at the next step boundary.
The consequence for load balancing is subtle and important: queue depth is not proportional to wait time. A replica with 4 waiting sequences whose running batch is mostly short answers will drain in 200ms. A replica with 1 waiting sequence behind 40 sequences each generating 4,000 tokens will not free memory for a minute. This is why we score on used_blocks and queue_tokens rather than waiting_seqs.
With continuous batching, throughput is bounded by KV cache blocks and latency is bounded by batch width. Any load signal that does not include memory occupancy is measuring the wrong resource.
PagedAttention block accounting
PagedAttention treats KV cache like virtual memory: fixed-size blocks of 16 tokens, a per-sequence block table, and no requirement that a sequence’s blocks be contiguous. That eliminates the internal fragmentation that made pre-allocated contiguous KV buffers waste 60 to 80 percent of memory, and it makes sharing possible, since two sequences with the same prefix can point at the same physical blocks with a reference count.
For the router this means capacity is countable in exact integers. We can compute precisely how many blocks a request needs and refuse to dispatch when the target lacks them.
# Exact KV block math for a request, used for admission and dispatch decisions.
def blocks_needed(prompt_tokens: int, max_tokens: int,
resident_blocks: int = 0, block_size: int = 16) -> int:
"""Total blocks a sequence will occupy at peak, minus blocks already shared."""
peak_tokens = prompt_tokens + max_tokens
total = -(-peak_tokens // block_size) # ceiling division
return max(1, total - resident_blocks)
def kv_bytes_per_block(num_layers: int, num_kv_heads: int, head_dim: int,
block_size: int = 16, dtype_bytes: int = 2) -> int:
"""2 for K and V. Llama-3-70B: 80 layers, 8 GQA kv heads, 128 head dim."""
return 2 * num_layers * num_kv_heads * head_dim * block_size * dtype_bytes
# Llama-3-70B with TP=2: each GPU holds half the kv heads
per_block = kv_bytes_per_block(80, 8 // 2, 128, 16, 2) # 2,621,440 bytes -> 2.5 MB
free_gb = (80 - 70) * 0.92 # 70 GB weights per card
print(int(free_gb * 1024**3 // per_block)) # about 3,600 blocks per card
Grouped-query attention is what makes this tractable. With 64 attention heads and full multi-head attention the KV cache per token would be 8x larger, and the 70B model would support a handful of concurrent sequences instead of dozens.
Bounded-load affinity with spill
Pure consistent hashing on prefix gives perfect cache locality and terrible balance. Pure least-loaded gives perfect balance and no cache locality. Bounded load takes the cache owner unless it exceeds a load ceiling, then falls through to scoring.
# Affinity with a hard load ceiling. Prevents cache locality from creating hotspots.
KV_CEILING = 0.80
def choose(owner: ReplicaState | None, candidates: list[ReplicaState],
router: Router, block_hashes: list[int], need: int) -> ReplicaState | None:
now = int(time.time() * 1000)
if owner and owner.healthy and free_tokens(owner) >= need:
util = owner.used_blocks / max(1, owner.total_blocks)
if util < KV_CEILING:
return owner # cache hit path, cheapest TTFT
fallback = [r for r in candidates
if r.healthy and free_tokens(r) >= need
and r.used_blocks / max(1, r.total_blocks) < 0.95]
if not fallback:
return None
return min(fallback, key=lambda r: router.score(r, block_hashes, now))
The ceiling is what makes affinity safe. Without it, the replica holding the most popular system prompt receives the most traffic, fills its KV cache, starts preempting, and the cache that made it attractive gets evicted under pressure. The 0.80 ceiling converts a positive feedback loop into a bounded one.
Outlier ejection with two-phase health
A replica can be up, answering /health with 200, and still be broken: CUDA in a bad state, an NCCL collective hung on one rank of a tensor-parallel pair, or a decode loop that has slowed to 4 tokens per second. HTTP health checks miss all three. We eject on behavior, not on liveness.
# Two-phase ejection: passive detection on real traffic, active probe before return.
import collections
class OutlierDetector:
def __init__(self, window: int = 50, err_ratio: float = 0.2,
tpot_ratio: float = 3.0, base_eject_s: int = 30):
self.err = collections.defaultdict(lambda: collections.deque(maxlen=window))
self.tpot = collections.defaultdict(lambda: collections.deque(maxlen=window))
self.consecutive = collections.Counter()
self.err_ratio = err_ratio
self.tpot_ratio = tpot_ratio
self.base_eject_s = base_eject_s
def observe(self, rid: str, ok: bool, tpot_ms: float | None) -> None:
self.err[rid].append(0 if ok else 1)
if tpot_ms:
self.tpot[rid].append(tpot_ms)
def should_eject(self, rid: str, fleet_p50_tpot: float) -> tuple[bool, int]:
errs = self.err[rid]
if len(errs) >= 20 and sum(errs) / len(errs) > self.err_ratio:
return True, self._backoff(rid)
samples = self.tpot[rid]
if len(samples) >= 20:
local = sorted(samples)[len(samples) // 2]
if local > fleet_p50_tpot * self.tpot_ratio:
return True, self._backoff(rid) # slow is worse than down
return False, 0
def _backoff(self, rid: str) -> int:
self.consecutive[rid] += 1
return min(300, self.base_eject_s * 2 ** (self.consecutive[rid] - 1))
def restored(self, rid: str) -> None:
self.consecutive[rid] = 0
self.err[rid].clear()
self.tpot[rid].clear()
Never eject more than a fixed fraction of a pool, typically 30 percent. A model rollout that makes every replica slow will otherwise trip ejection on all of them at once and take the pool to zero capacity, converting degraded latency into a full outage.
Scaling and Performance
The gateway tier scales trivially because it holds no authoritative state. Each pod handles roughly 1,600 requests per second of proxying and 2,000 concurrent streams on 4 vCPUs, with tokenization being the main CPU cost. Scale on concurrent connections, not CPU, since a pod streaming 4,000 idle-ish SSE connections looks unloaded right up until its event loop saturates.
What does not scale horizontally is a single replica’s KV cache. A 70B model with tensor parallelism degree 2 has about 20 GB of memory left for KV after weights, which is roughly 7,200 blocks, or 115,000 tokens of concurrent context. At 2,100 tokens of peak footprint per request that is 54 concurrent sequences, hard stop. No amount of routing intelligence changes that number. Increasing it means quantizing weights to FP8, raising tensor parallelism to spread weights over more cards, or shortening max_model_len.
Given:
- 5,000 req/s peak, 1,800 input tokens, 300 output tokens per request
- 70B pool takes 20% of traffic (1,000 req/s), 8B pool takes 80% (4,000 req/s)
- Llama-3-70B FP16 = 140 GB weights, TP=2 across 2x A100 80GB
- KV per block (16 tok) at TP=2 = 2.5 MB per GPU, 5.0 MB per replica
- Measured decode: 41 tok/s/seq at batch 38 on the 70B pool
70B pool sizing
KV free per replica: (80 - 70) GB * 0.92 * 2 GPUs = 18.4 GB
Blocks per replica: 18.4 GB / 5.0 MB = 3,680 blocks = 58,880 tokens
Peak per request: 1,800 + 300 = 2,100 tokens = 132 blocks
With 15% headroom: 3,128 usable blocks -> 23 concurrent seqs per replica
Time per request: 300 tokens / 41 tok/s = 7.3 s
Throughput/replica: 23 / 7.3 = 3.1 req/s
Replicas needed: 1,000 / 3.1 = 323 replicas (blows the GPU budget)
Fix: 60% prefix cache hit rate cuts prefill work, not KV footprint.
Real lever is output length and model choice. Route 80% of the 70B traffic
to the 8B pool where a replica holds 62 GB of KV:
Blocks per 8B replica: 62 GB * 0.92 / 0.63 MB = 90,000 blocks
Concurrent seqs: 90,000 * 0.85 / 132 = 579 (batch-capped at 256)
Throughput/replica: 256 / (300/95 tok/s) = 81 req/s
Replicas for 4,800 req/s: 60 replicas
Final fleet: 16x 70B (TP=2, 32 GPUs) + 40x 8B (40 GPUs) + 8x LoRA = 80 GPUs
Cost at $3.20/GPU-hour on demand: $256/hour, $2,240/hour at 8.75x for
reserved-equivalent all-in with networking, storage, and 30% overprovision.
That estimate is the whole argument for model routing. Serving all traffic on the 70B pool needs 323 replicas and 646 GPUs. Sending the 80 percent of traffic that an 8B model handles acceptably to the cheap pool needs 80 GPUs total. The router is a cost lever disguised as a latency component.
Caching operates at three levels with very different hit economics. The prefix cache on the GPU removes prefill compute for shared prompt spans, hitting 60 to 85 percent on agent and RAG traffic. A semantic cache in front of the gateway short-circuits near-duplicate questions entirely, typically hitting 10 to 30 percent on support workloads at the price of an embedding lookup. An exact response cache keyed on the full request hash plus sampling parameters is only useful at temperature: 0, where it hits 3 to 8 percent and costs nothing. Read-heavy tenants see the biggest wins; the hot spot to watch is a single popular system prompt whose owner replica becomes a magnet, which is exactly what the 0.80 utilization ceiling exists to contain.
Disaggregating prefill from decode is how the largest deployments broke the coupling between the two phases. DeepSeek’s serving stack and NVIDIA Dynamo run separate prefill and decode pools and transfer KV blocks over the interconnect, because prefill is compute bound and decode is memory bandwidth bound, and batching them together forces one to wait on the other.
Cost and Token Economics
The cost drivers rank in a fixed order for self-hosted serving: GPU-hours dominate at 85 to 92 percent of total, inter-GPU networking and the gateway tier take 5 to 10 percent, and observability plus storage take the remainder. Output tokens cost roughly 3 to 5x what input tokens cost, because prefill processes the whole prompt in one parallel pass while every output token requires a full forward pass over the model weights.
| Configuration | Cost per 1M output tokens | TTFT p99 | Notes |
|---|---|---|---|
| Frontier API provider, 70B-class | $15.00 in / $60.00 out | 350 ms | Zero ops, no cache control, no tenant isolation |
| Self-hosted 70B, TP=2, 45% utilization | $12.40 | 380 ms | Utilization is the whole problem, idle GPUs still bill |
| Self-hosted 70B, TP=2, 78% utilization | $7.15 | 390 ms | KV-aware routing plus continuous batching |
| Self-hosted 70B, FP8 quantized, 78% util | $4.10 | 310 ms | 70 GB weights instead of 140, 2x the KV headroom |
| Self-hosted 8B, TP=1, 80% utilization | $0.62 | 145 ms | Handles roughly 80% of traffic acceptably |
| 8B + 70B router with semantic cache | $1.85 blended | 160 ms | 22% cache hit, 80/20 traffic split |
The single highest-leverage optimization we measured was raising KV block occupancy from 45 percent to 78 percent by switching from least-connections to KV-aware routing with prefix affinity. On a 32-GPU 70B pool at $3.20 per GPU-hour, that is $102 per hour of GPU time serving 73 percent more tokens: about $310,000 a year of throughput recovered from the same hardware, with no model change and no quality tradeoff. Prefix cache hits contributed a second-order win by cutting mean TTFT from 480ms to 190ms, which let us hold the SLA at higher batch sizes instead of overprovisioning for latency.
Model routing beats every other lever by an order of magnitude. Moving 80 percent of traffic from a 70B pool to an 8B pool takes blended cost from $7.15 to $1.85 per million output tokens. On 40 billion output tokens a year that is $212,000 versus $286,000 for the routing plus caching work combined, and the 8B pool answers faster.
Quality, Evaluation, and Guardrails
A gateway fails softly. Route to a replica running a stale model revision and every response is subtly worse with no error anywhere. Corrupt the prefix cache map and requests land on cold replicas, tripling TTFT while every health check stays green. Truncate a stream at token 250 of 300 and the user gets a confident half-answer that looks complete.
The metrics that gate a deploy are split between mechanical and semantic. Mechanically we assert TTFT p99, TPOT p95, error rate, and cache hit rate against a canary carrying 5 percent of traffic for 30 minutes. Semantically we replay a golden set of 500 recorded requests through both the current and candidate configuration and compare responses, because a routing change that silently sends traffic to the wrong pool shows up as a quality delta long before it shows up as an error.
# Deploy gate: canary must pass mechanical SLOs and semantic equivalence.
import numpy as np
def canary_gate(canary: dict, baseline: dict, golden_scores: list[float]) -> tuple[bool, str]:
"""canary/baseline hold arrays of ttft_ms, tpot_ms, ok flags, cache_hit flags."""
if len(canary["ttft_ms"]) < 500:
return False, "insufficient_samples"
ttft_p99 = float(np.percentile(canary["ttft_ms"], 99))
if ttft_p99 > 400:
return False, f"ttft_p99={ttft_p99:.0f}ms exceeds 400ms"
tpot_p95 = float(np.percentile(canary["tpot_ms"], 95))
if tpot_p95 > 50:
return False, f"tpot_p95={tpot_p95:.1f}ms exceeds 50ms"
err = 1 - float(np.mean(canary["ok"]))
base_err = 1 - float(np.mean(baseline["ok"]))
if err > max(0.002, base_err * 1.5):
return False, f"error_rate={err:.4f} regressed from {base_err:.4f}"
hit = float(np.mean(canary["cache_hit"]))
base_hit = float(np.mean(baseline["cache_hit"]))
if hit < base_hit - 0.10:
return False, f"prefix_hit={hit:.2f} dropped from {base_hit:.2f}"
# semantic gate: LLM-as-judge pairwise score on 500 golden requests, 1-5 scale
mean_score = float(np.mean(golden_scores))
p10 = float(np.percentile(golden_scores, 10))
if mean_score < 4.2 or p10 < 3.0:
return False, f"golden mean={mean_score:.2f} p10={p10:.2f} below threshold"
return True, "pass"
Rollback triggers on any single condition: TTFT p99 above 400ms for 5 consecutive minutes, error rate above 0.2 percent, prefix hit rate dropping more than 10 points, or the golden set mean falling below 4.2. Prefix hit rate is in that list because it is the earliest indicator that routing logic broke, and it moves minutes before latency does.
The guardrails on the request path are deliberately thin, since every millisecond here is TTFT. We validate max_tokens against max_model_len minus prompt length and reject early rather than letting the engine truncate. We cap prompt length per tier so one tenant cannot pin 40 GB of KV cache with a 128k-token prompt. We validate the model alias against the tenant’s allowed pools so a free-tier key cannot route to the 70B pool. Anything heavier, such as prompt injection scanning or PII redaction, runs in a separate policy service that the gateway calls in parallel with tokenization so it adds zero serial latency for the 99 percent of requests that pass.
The regression that will bite you is a replica quietly serving an older model revision after a partial rollout. Errors stay at zero, latency looks fine, and only the golden-set score moves. Assert the revision hash reported by every replica’s /v1/models against the expected value on every registry refresh, and eject on mismatch.
Failure Modes and Recovery
| Failure | Detection | Impact | Recovery |
|---|---|---|---|
| KV cache OOM mid-generation | vllm preemption counter rises, TPOT p95 doubles on one replica | Sequences swapped to CPU, affected users see 400ms per token stalls | Raise headroom_ratio for that pool, mark replica draining, let in-flight sequences finish, stop admitting |
| Replica cold start after scale-up | Replica registers state=loading, /health fails for 90 to 240 seconds | New capacity unavailable during a traffic spike, queue grows | Keep 2 warm standby replicas per pool, preload weights to local NVMe, never route to loading replicas |
| Model revision skew across replicas | Revision hash from /v1/models differs from expected on registry refresh | Silent quality regression, no errors, golden score drops | Eject mismatched replica, block the rollout, redeploy from the pinned digest |
| Prefix map poisoning after replica loss | Owner lookups resolve to an ejected replica, hit rate collapses | TTFT triples fleet-wide as every request cold-prefills | Publish a tombstone on ejection, scan and delete pfx:* entries for that replica id, 180s TTL bounds the blast radius |
| Tensor-parallel rank hang | One GPU in a TP pair stops progressing, NCCL collective blocks, /health still returns 200 | Replica accepts requests and never produces tokens, streams hang until timeout | Behavioral ejection on zero tokens produced within 2x expected TTFT, then hard restart the whole TP group |
| Thundering herd after ejection | Ejected replica’s share redistributes instantly, remaining replicas spike to 95 percent KV | Cascading ejections take the pool to zero | Power-of-two-choices spreads the shift, ejection cap of 30 percent per pool, admission control sheds with 429 rather than queueing into oblivion |
| Upstream provider 429 on fallback path | Fallback provider returns rate limit errors while self-hosted pool is saturated | Requests fail after already waiting in queue | Token bucket per provider on the gateway side, shed at admission instead of discovering the limit after 8 seconds of queueing |
The most common operational mistake is treating a slow replica as healthy. HTTP health checks pass on a replica whose decode loop has degraded to 4 tokens per second, and because it holds few sequences its KV utilization looks low, so a naive router sends it more traffic. Slow replicas must be ejected on behavior, and they must be ejected faster than dead ones because they actively attract work.
Comparison of Approaches
| Approach | TTFT p99 | GPU utilization | Complexity | Dominant failure mode | Best fit |
|---|---|---|---|---|---|
| Round robin | 900 ms | 40 to 50% | Trivial, an nginx config | Long prompts land on full replicas, preemption storms | Uniform prompt sizes, low traffic prototypes |
| Least connections | 620 ms | 55 to 62% | Low, built into most proxies | One connection is not one unit of work, long generations hide load | Mixed traffic where output lengths are similar |
| Least outstanding tokens | 430 ms | 68 to 72% | Medium, needs token accounting per replica | Ignores prefix cache, pays full prefill on every request | Chat traffic with little prompt sharing |
| KV-aware plus prefix affinity | 390 ms | 75 to 80% | High, needs metrics push, prefix hashing, spill logic | Affinity hotspots without a load ceiling | RAG and agent traffic with shared system prompts |
| Disaggregated prefill and decode | 240 ms | 82 to 88% | Very high, two pools plus KV transfer over interconnect | KV transfer bandwidth becomes the bottleneck | Very long prompts, strict TTFT SLAs, large fleets |
| Managed API provider | 350 ms | Not your problem | None | No cache control, no isolation, 4 to 8x the cost | Early products, spiky traffic, small volumes |
For a 64-replica fleet serving RAG and agent traffic, KV-aware routing with bounded prefix affinity is the right pick. It captures the large win, which is the jump from 50 percent to 78 percent block occupancy, without the operational weight of disaggregation. Disaggregated prefill and decode is genuinely better at the top end, but it doubles the number of pools to operate and introduces a KV transfer path that becomes its own capacity planning problem. We would move to it when p99 prompt length crosses about 8,000 tokens, where prefill starts consuming more than 40 percent of GPU time and the coupling between phases becomes the binding constraint.
Key Takeaways
- KV cache occupancy is the capacity signal. Request counts and connection counts do not correlate with GPU memory pressure, and memory is what runs out first.
- Prefix cache affinity is worth more than perfect balance. A cache hit removes prefill compute entirely, cutting
TTFTby 3x, which no balancing strategy can match. - Bound your affinity. Route to the cache owner only below a KV utilization ceiling, or the most useful replica becomes the most overloaded one.
- Continuous batching decouples queue depth from wait time. Score on
queue_tokensandused_blocks, never onwaiting_seqs. - Cancellation is capacity. Propagating client disconnects to the engine returned about 11 percent of KV blocks on agent traffic, more than any routing tweak delivered.
- Reserve pessimistically, refund on completion. Charging
input_tokens + max_tokensup front and refunding the unused portion is the only way token quotas hold under streaming. - Slow replicas are more dangerous than dead ones. A degraded replica passes health checks, reports low utilization, and attracts traffic, so eject on behavior rather than liveness.
- Model routing dominates every other cost lever. Moving 80 percent of traffic to a smaller pool cut blended cost per million output tokens by 4x, which no amount of infrastructure tuning approaches.
The counter-intuitive lesson is that the best inference gateway is not the one that balances load most evenly. Even balance is a proxy goal borrowed from stateless services, and in LLM serving it actively fights the thing that matters, which is keeping attention state resident where it can be reused. The gateway that runs deliberately unbalanced, concentrating related requests on replicas that already hold their KV blocks while enforcing a hard pressure ceiling, delivers both lower latency and higher throughput than the one chasing a flat utilization graph.
Frequently Asked Questions
Q: Why not just use a service mesh or nginx with least-connections and skip all of this?
A: Because a connection is not a unit of work. Two requests on identical connections can differ by 100x in GPU time and by 500x in KV memory footprint, and a mesh has no visibility into either. You can get to roughly 55 percent utilization with least-connections, which for a 64-GPU fleet means leaving about $700,000 a year of GPU capacity idle. The mesh is still useful for mTLS and retries, it is just the wrong thing to make the routing decision.
Q: Why not have the engine handle load balancing internally with a shared queue?
A: A shared queue across replicas gives you optimal work conservation and destroys prefix caching, because any replica can pull any request and cache locality becomes random. It also creates a coordination point that has to be highly available and sub-millisecond, which is a harder system to operate than a stateless router reading a 250ms-stale load table. Disaggregated prefill and decode is the better version of this idea: keep the queue per phase, not per fleet.
Q: How much does the prefix cache actually help, and when does it not?
A: On RAG and agent workloads with shared system prompts we measured 60 to 85 percent block hit rates, cutting mean TTFT from 480ms to 190ms. It helps roughly not at all on traffic where every prompt is unique and short, such as classification or embedding-style calls, because there is no shared span to reuse and the affinity logic just adds a Redis round trip. Measure hit rate before you build affinity routing; if it is under 20 percent, least-outstanding-tokens is simpler and nearly as good.
Q: What is the single biggest cost mistake teams make here?
A: Sizing the fleet for peak on the largest model. Teams provision a 70B pool for 100 percent of traffic, run it at 45 percent utilization for latency headroom, and pay roughly $12.40 per million output tokens. Routing by task complexity to an 8B pool for the 80 percent of requests that do not need frontier quality takes blended cost to about $1.85. The second biggest mistake is not refunding unused max_tokens, which forces conservative quotas and leaves capacity on the table.
Q: How do you catch quality regressions when the gateway itself never changes model behavior?
A: The gateway changes which weights answer the request, which is a quality decision even when it looks like an infrastructure decision. We gate deploys on a 500-request golden set replayed through the canary with LLM-as-judge pairwise scoring, and we alert on prefix hit rate and per-pool traffic share. A routing bug that sends 8B traffic to the 70B pool shows up as a cost spike; the reverse shows up only in the golden score, so both directions need a signal.
Q: Does tensor parallelism degree change the routing logic?
A: It changes the accounting, not the algorithm. A TP=2 replica is one routing target with the pooled KV of two GPUs and the failure domain of two GPUs, so both cards must be healthy for the replica to be routable. Higher TP degree buys KV headroom and lower TPOT at the cost of all-reduce overhead on every layer, so past degree 4 on a single node you are paying interconnect tax for capacity you could get more cheaply by quantizing weights to FP8.
Interview Questions
Q: Design the load balancing strategy for a fleet of 50 LLM replicas serving mixed prompt lengths from 100 to 32,000 tokens. What signals do you route on?
Expected depth: Reject request-count and connection-count signals with the reasoning about non-uniform work. Name KV cache block occupancy, pending prefill tokens, and prefix overlap as the three signals. Discuss power-of-two-choices to avoid herding on stale metrics, staleness decay, and why the router needs headroom reserved so continuous batching never preempts.
Q: A single replica in your pool is 5x slower than its peers but returns 200 on every health check. Walk through detection and mitigation.
Expected depth: Distinguish liveness from behavior. Propose passive outlier detection on TPOT percentiles relative to fleet median, a minimum sample count before ejecting, exponential ejection backoff, and a cap on the fraction of a pool that can be ejected. Cover the TP rank hang case where NCCL blocks and the process stays alive, and why slow replicas attract traffic under naive routing.
Q: Compute how many concurrent requests one A100 80GB can serve for an 8B model with 2,000-token prompts and 500-token outputs. Show the KV math.
Expected depth: Weights at 16 GB in BF16, roughly 62 GB usable for KV after activation overhead. KV per token equals 2 times layers times kv_heads times head_dim times dtype bytes, so 32 layers with 8 GQA heads at 128 dim in FP16 is 131 KB per token. 2,500 tokens per sequence is about 328 MB, giving roughly 190 concurrent sequences before the engine’s own batch cap binds. Then discuss why the practical limit is lower once you reserve headroom.
Q: Your prefix cache hit rate drops from 70 percent to 12 percent after an autoscaling event. Diagnose it.
Expected depth: Scale-out redistributed prefix ownership, so previously warm replicas no longer own the hot hashes and the map points at replicas that were ejected or replaced. Discuss tombstones on ejection, TTL bounding the damage window, gradual traffic ramp for new replicas so they warm up before taking full share, and why consistent hashing with bounded load degrades more gracefully than a plain owner map.
Q: Design token quota enforcement that works correctly with streaming responses.
Expected depth: Pessimistic reservation of input_tokens + max_tokens at admission, atomic check-and-decrement in a single Redis script to avoid races across gateway pods, refund on stream termination including the client-abort path, and a separate concurrency semaphore because sustained rate and instantaneous KV footprint are different constraints. Cover what breaks if you bill only on completion: 500 concurrent streams can pass a quota check that the tenant cannot afford.
Premium Content
Unlock the full article along with everything else in the archive — all in one place.