Build a Model Sharding System for Serving 70B+ Parameter Models


performance scalability distributed-systems

AI System Design Deep Dive

Model Sharding for 70B+ LLMs

No single GPU holds the weights. Eight must act like one without stalling.

⏱ 14 min read📐 Advanced🧠 LLM Inference

A symphony orchestra performing a score too dense for any single musician to sight-read alone splits the parts across sections: strings carry one set of measures, brass another, percussion a third, and every section has to land on the same beat within a few milliseconds or the piece falls apart. Serving a 70 billion parameter language model has the same shape of problem. The model’s weights in FP16 come to roughly 140GB, and the largest single GPU commonly available for inference, an A100 80GB, holds less than half of that. There is no version of this problem where one GPU does the job. Eight have to act like one, and every one of them has to agree, layer by layer, on what just happened.

The naive fix looks simple: cut the model into eight pieces, put one piece on each GPU, and pass activations down the line like a relay baton. That is pipeline parallelism, and it works, but only if every runner is handed the baton at a steady cadence. An 80-layer, 70B-parameter model split eight ways gives each GPU ten layers to run before handing off. While GPU 0 computes its ten layers for the next token, GPUs 1 through 7 are either waiting for GPU 0’s output or already idle because they finished their slice of the previous token and have nothing queued behind it. That idle time is a pipeline bubble, and at low concurrency it can eat well over half of every GPU’s cycles. Sharding fixes the memory problem and creates a new scheduling problem in the same motion.

The alternative, tensor parallelism, cuts every matrix multiply inside every layer into slices instead of cutting layers between GPUs. Now all eight GPUs work on every layer simultaneously, each holding a slice of every weight matrix, and there is no idle relay handoff. The cost shows up somewhere else: after every attention block and every MLP block, the GPUs have to exchange partial results and sum them, an operation called all-reduce, and that exchange has to complete fast enough that it never becomes the bottleneck it was supposed to avoid. Across 8 GPUs connected by NVLink at roughly 600GB/s inside one node, that exchange is nearly free. Cross a node boundary onto InfiniBand at around 25GB/s effective bandwidth with meaningfully higher per-hop latency, and the same exchange can cost more than the compute it is protecting.

Quantization changes the equation from a completely different angle: cut every weight from 16 bits down to 8 or fewer, and the 140GB footprint shrinks to 70GB or less. That can mean fewer GPUs per replica and more replicas per node, trading a small amount of numerical precision for a large amount of shard count. We need to solve for three things simultaneously: how to split the model across GPUs so neither all-reduce overhead nor pipeline idle time dominates, how much of each GPU’s memory to reserve for weights versus the KV cache that holds every active conversation’s attention history, and how to route requests across many replica groups so no single shard group turns into a hot spot while another sits half empty.

Key Insight

The sharding decision is not model-versus-hardware, it is a three-way trade between all-reduce communication cost (tensor parallelism), pipeline idle time (pipeline parallelism), and shard count (quantization). Every real serving plan picks a point on that triangle, not a single axis.

Requirements and Constraints

Functional Requirements

  • Load a checkpoint for a 70B+ parameter dense transformer and partition its weights across a fixed GPU topology (8x A100 80GB per node) according to a chosen tensor parallelism degree and pipeline parallelism degree
  • Execute a full forward pass, both prefill and decode, across the sharded layout, synchronizing partial results via NCCL collectives at every tensor-parallel boundary
  • Stream tokens back to the client as they are generated, producing the same output distribution the unsharded model would (numerically exact for FP16, bounded-delta for quantized modes)
  • Run multiple replica groups concurrently, each an independent shard of GPUs, and route new requests to whichever replica group has KV cache headroom
  • Support re-sharding to a new TP/PP degree or quantization mode through rolling replica replacement, without a full-fleet outage
  • Detect a shard group whose GPUs report a communication failure (NCCL timeout) and evict it before it silently serves degraded or hung requests

Non-Functional Requirements

  • Latency: time-per-output-token (TPOT) p99 under 25ms, sustaining at least 40 tokens/second per active sequence during decode
  • Throughput: aggregate decode tokens/second per replica, and total node throughput as replica density scales with quantization mode
  • Quality: sharded execution must match a trusted reference shard plan within a bounded perplexity delta on a golden eval set; FP16 plans should be near bit-identical modulo floating-point summation order in the all-reduce
  • Cost: dollars per million output tokens must improve, or at minimum not regress, as the fleet moves from a low-shard-count plan to a higher-density plan enabled by quantization
  • Capacity: GPU memory footprint per shard is weights plus activation buffers plus KV cache, with KV cache capped at 20GB per GPU shard to leave headroom for in-flight micro-batches and allocator fragmentation

Constraints

  • Assume a 70B-class dense transformer matching the Llama-3 70B architecture shape: 80 transformer layers, hidden size 8192, 64 attention heads, 8 KV heads via grouped-query attention (GQA), head dim 128, FP16 weights
  • Assume 8x A100 80GB GPUs per node, fully connected by NVLink/NVSwitch inside the node at roughly 600GB/s, and InfiniBand (200Gb/s, ~25GB/s effective) between nodes
  • Assume checkpoint shards are pre-sharded and stored in an object store; re-sharding a live checkpoint from one layout to another on the fly is out of scope
  • Out of scope: training or fine-tuning workloads. There is no gradient all-reduce and no optimizer state sharding here, this is serving-only
  • Out of scope: mixture-of-experts routing. This design assumes a dense architecture where every token visits every layer
Key Insight

The 20GB KV cache cap per shard is not a memory limit, it is a concurrency lever. Every gigabyte not spent on KV cache is a gigabyte that cannot serve another simultaneous conversation, so the “wasted” headroom in this budget is insurance against micro-batch and fragmentation overhead eating into concurrency you already promised.

High-Level Architecture

The system has six major components. The Shard Planner decides, at fleet provisioning time, the tensor parallelism degree, pipeline parallelism degree, and quantization mode for a replica group given the GPU topology and memory budget. The Checkpoint Loader reads pre-sharded weight files from the object store into exactly the GPU shard that owns each partition. The Tensor-Parallel Shard Group is the set of GPUs inside one pipeline stage that jointly hold every layer in that stage, split by row and column. The Pipeline Stage Runtime groups layers into stages and schedules micro-batches so stage handoffs stay full instead of idle. The NCCL Collective Coordinator issues all-reduce inside a TP group and point-to-point send/recv between pipeline stages, over NVLink or InfiniBand depending on placement. The Replica Router is the front door that assigns incoming requests to whichever replica group has KV cache headroom and rebalances as load shifts.
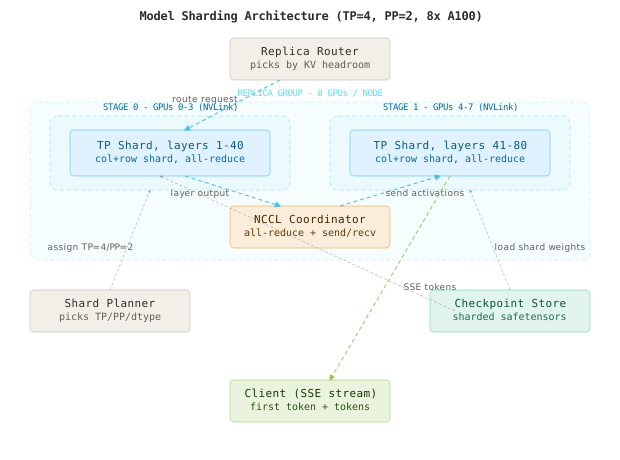
Architecture overview showing the replica router assigning requests into a replica group split into two tensor-parallel pipeline stages connected by an NCCL coordinator, with a shard planner and checkpoint store provisioning the group at startup

A request lands at the Replica Router, which checks KV cache headroom across replica groups and assigns the request to the least-loaded one. Inside that replica group, the request enters Stage 0, a 4-GPU tensor-parallel shard holding the first half of the model’s layers; every attention and MLP block in that stage runs on all four GPUs simultaneously, with the NCCL Collective Coordinator firing an all-reduce after each block to sum partial results. When Stage 0 finishes its last layer, the coordinator sends the resulting activations to Stage 1, a second 4-GPU tensor-parallel shard holding the remaining layers, which repeats the same pattern before streaming tokens back to the client over SSE.

Before any of that runs, the Shard Planner decides this replica group’s TP=4, PP=2 layout based on the fixed 8-GPU node and the model’s memory footprint, and the Checkpoint Loader pulls the matching weight shard into each of the eight GPUs from the object store, verifying a checksum against the manifest before the replica accepts traffic.

Key Insight

The single most important architectural decision is keeping every tensor-parallel all-reduce inside one NVLink domain, and letting pipeline parallelism, not tensor parallelism, be the dimension that crosses node boundaries. All-reduce happens dozens of times per token; a stage handoff happens once.

The Shard Planner

The planner’s job is to pick a tensor parallelism degree, a pipeline parallelism degree, and a quantization mode that fit the model into the fixed GPU topology without violating the KV cache budget.

The non-obvious part: a smart engineer’s first instinct is to maximize tensor parallelism degree, since TP keeps every GPU active on every layer and avoids pipeline bubbles entirely. That is correct for latency but assumes the NVLink domain is large enough to hold the whole TP group, and it ignores that a bigger TP group means a bigger all-reduce every single layer. The planner has to weigh “no bubbles” against “cheaper, smaller collectives” rather than defaulting to the largest TP degree the hardware allows.

# Shard planner: picks TP degree, PP degree, and quantization mode for a fixed GPU budget
from dataclasses import dataclass

BYTES_PER_PARAM = {"fp16": 2, "int8": 1, "fp8": 1}
NVLINK_DOMAIN_SIZE = 8  # GPUs fully connected by NVSwitch in one node

@dataclass
class ShardPlan:
    tp_degree: int
    pp_degree: int
    dtype: str
    gpus_per_replica: int
    weight_bytes_per_gpu: float
    kv_cache_budget_bytes: int

def plan_shard_layout(
    total_params: int,
    num_layers: int,
    num_kv_heads: int,
    gpu_memory_bytes: int,
    kv_cache_cap_bytes: int,
    dtype: str = "fp16",
) -> ShardPlan:
    bytes_per_param = BYTES_PER_PARAM[dtype]
    total_weight_bytes = total_params * bytes_per_param

    best = None
    for tp in (1, 2, 4, 8):
        if tp > NVLINK_DOMAIN_SIZE or num_kv_heads % tp != 0:
            continue  # TP must stay inside one NVLink domain and divide KV heads evenly
        for pp in (1, 2, 4, 8):
            gpus = tp * pp
            if gpus > 8 or num_layers % pp != 0:
                continue
            weight_per_gpu = total_weight_bytes / gpus
            activation_overhead = 3 * (1024 ** 3)  # ~3GB reserved for buffers, NCCL, CUDA context
            headroom = gpu_memory_bytes - weight_per_gpu - activation_overhead
            if headroom < kv_cache_cap_bytes:
                continue  # doesn't leave the required KV cache budget
            replicas_per_node = 8 // gpus
            score = replicas_per_node  # prefer plans that pack more replicas per node
            if best is None or score > best[0]:
                best = (score, ShardPlan(tp, pp, dtype, gpus, weight_per_gpu, kv_cache_cap_bytes))
    if best is None:
        raise ValueError("no shard layout fits the memory budget at this dtype")
    return best[1]

What breaks if you simplify this to “always use the maximum TP degree the node supports”: at FP16, TP=8/PP=1 still fits the memory budget, but every layer’s all-reduce now spans all 8 GPUs instead of 4, and a single dead or slow GPU stalls the entire replica instead of half of it. The planner’s job is to find the smallest TP group that keeps all-reduce cheap, and use pipeline parallelism to absorb the rest of the GPU count.

Watch Out

A shard plan chosen once at launch and never revisited quietly becomes wrong as GPU generations change. An H100 node’s NVLink bandwidth and per-hop latency are different enough from an A100 node’s that a plan tuned for one can leave the other’s GPUs under-utilized or its collectives needlessly slow.

The Tensor-Parallel Shard Group

Each GPU inside a TP group’s job is to hold one slice of every weight matrix in its assigned layers and compute its slice of every forward pass, staying synchronized with the rest of the group at every collective boundary.

The mechanism is the Megatron-LM sharding pattern: split the first linear layer of a block along its output dimension (column-parallel), so each GPU computes a different slice of attention heads or MLP intermediate activations with zero communication, then split the second linear layer along its input dimension (row-parallel), so each GPU produces a partial output that has to be summed across the group before the block is done. Column-parallel needs no communication going in. Row-parallel needs exactly one all-reduce coming out.

Tensor-parallel shard group internals showing column-parallel QKV projection with no communication, per-GPU local attention, and row-parallel output projection requiring an all-reduce across the four GPUs in the group
# Column-parallel and row-parallel linear layers: the Megatron-LM sharding pattern
import torch
import torch.distributed as dist
import torch.nn as nn

class ColumnParallelLinear(nn.Module):
    # splits the output dimension across the TP group; no communication needed on the way in
    def __init__(self, in_features: int, out_features: int, tp_group):
        super().__init__()
        self.tp_group = tp_group
        world_size = dist.get_world_size(tp_group)
        assert out_features % world_size == 0
        self.local_out = out_features // world_size
        self.weight = nn.Parameter(torch.empty(self.local_out, in_features, dtype=torch.float16))

    def forward(self, x: torch.Tensor) -> torch.Tensor:
        return torch.nn.functional.linear(x, self.weight)  # each rank returns its own slice

class RowParallelLinear(nn.Module):
    # splits the input dimension across the TP group; requires an all-reduce on the way out
    def __init__(self, in_features: int, out_features: int, tp_group):
        super().__init__()
        self.tp_group = tp_group
        world_size = dist.get_world_size(tp_group)
        assert in_features % world_size == 0
        self.local_in = in_features // world_size
        self.weight = nn.Parameter(torch.empty(out_features, self.local_in, dtype=torch.float16))

    def forward(self, x_shard: torch.Tensor) -> torch.Tensor:
        partial = torch.nn.functional.linear(x_shard, self.weight)
        dist.all_reduce(partial, op=dist.ReduceOp.SUM, group=self.tp_group)
        return partial

class TPAttentionBlock(nn.Module):
    # QKV projection is column-parallel (each GPU gets a slice of attention heads)
    # output projection is row-parallel (partial outputs summed via all-reduce)
    def __init__(self, hidden: int, qkv_dim: int, tp_group):
        super().__init__()
        self.qkv_proj = ColumnParallelLinear(hidden, qkv_dim, tp_group)
        self.o_proj = RowParallelLinear(hidden, hidden, tp_group)

    def forward(self, x: torch.Tensor, attn_fn) -> torch.Tensor:
        qkv_shard = self.qkv_proj(x)          # no communication yet
        attn_out_shard = attn_fn(qkv_shard)   # local attention over this GPU's heads
        return self.o_proj(attn_out_shard)    # all-reduce happens here

The MLP block follows the identical pattern: gate_proj and up_proj are column-parallel, splitting the intermediate dimension across the group, and down_proj is row-parallel, needing its own all-reduce. That is two all-reduces per transformer layer, once for attention and once for the MLP, times however many layers this GPU’s pipeline stage owns.

What would break if you simplified this to naive data parallelism instead, giving each GPU a full, separate copy of the model: it would not fit. A 70B model in FP16 needs 140GB and no single A100 has more than 80GB. Tensor parallelism is not an optimization here, it is the only way the weights fit at all.

Real World

Megatron-LM, NVIDIA’s tensor-parallel training and inference library, introduced exactly this column-then-row sharding pattern, and it has since been adopted almost unchanged by DeepSpeed-Inference, TensorRT-LLM, and vLLM’s tensor-parallel backend, because the two-all-reduces-per-layer structure generalizes cleanly to any dense transformer.

The Pipeline Stage Runtime

The pipeline runtime’s job is to keep activations flowing between stages with as little idle time as possible, since idle GPU time in a pipeline is time that was paid for and not used.

The non-obvious part: pipeline bubbles are not a fixed tax, they shrink as concurrency grows. A single request moving through a two-stage pipeline leaves one stage idle while the other works. Many concurrent requests, or a long prompt split into several chunks, give the pipeline enough independent units of work to keep both stages busy at (almost) all times. The classic GPipe result for the fraction of idle time is (p - 1) / (m + p - 1), where p is the number of pipeline stages and m is the number of micro-batches in flight.

# Pipeline scheduler: warm-up / steady-state / drain schedule for stage-crossing micro-batches
from dataclasses import dataclass

@dataclass
class StageTiming:
    stage_id: int
    compute_ms: float  # time to run this stage's layers on one micro-batch

def bubble_fraction(num_stages: int, num_microbatches: int) -> float:
    # classic GPipe-style bubble ratio: idle time as a fraction of total pipeline time
    if num_microbatches < 1:
        raise ValueError("need at least one microbatch")
    return (num_stages - 1) / (num_microbatches + num_stages - 1)

def schedule_forward(num_stages: int, num_microbatches: int) -> list[list[int]]:
    # returns, per timestep, which microbatch index each stage is processing (-1 = idle/bubble)
    total_steps = num_microbatches + num_stages - 1
    schedule = []
    for t in range(total_steps):
        step = [t - s if 0 <= t - s < num_microbatches else -1 for s in range(num_stages)]
        schedule.append(step)
    return schedule

At PP degree 2 with a single micro-batch, bubble_fraction(2, 1) returns 0.5, half the pipeline’s time is idle. At 4 micro-batches (a 4-way chunked prompt, or 4 sequences arriving close together), it drops to 0.2. At 15 concurrent micro-batches, a realistic decode-time concurrency level, it is down near 0.06. This is the same formula in two disguises: during prefill, the micro-batches are chunks of one long prompt; during decode, they are the naturally independent steps of every concurrently active sequence, which is exactly what continuous batching already provides.

Token flow diagram showing a request moving through stage 0's tensor-parallel group, an all-reduce, a send to stage 1 over NVLink, a second all-reduce, a vocabulary all-gather, and a streamed token back to the client, looping for each decode step
Watch Out

A pipeline tuned and load-tested at high concurrency looks perfect until a quiet period drops concurrent sequences to single digits. The bubble fraction that was negligible at 200 concurrent sequences becomes the dominant cost at 5, and GPU-hours per token spikes during exactly the traffic dip when nobody is watching the dashboard.

The NCCL Collective Coordinator

The coordinator’s job is to issue every all-reduce inside a TP group and every send/recv across a pipeline boundary, and to notice immediately when one hangs instead of letting the whole replica stall silently.

The non-obvious part: a hung collective does not look like a crash. Every GPU in the group is spinning at 100% utilization waiting on the same barrier, which looks identical to a healthy GPU doing useful work on every dashboard that only tracks utilization percentage. The coordinator has to treat “collective did not complete within its timeout” as a first-class failure signal, not “collective returned an error,” because NCCL under a dead peer often just never returns.

# NCCL health wrapper: detects a stalled collective and evicts the shard group instead of hanging forever
import torch.distributed as dist
from datetime import timedelta

ALL_REDUCE_TIMEOUT = timedelta(seconds=2)

class ShardGroupUnhealthy(Exception):
    pass

class NCCLCoordinator:
    def __init__(self, tp_group, pp_group, node_id: str):
        self.tp_group = tp_group
        self.pp_group = pp_group
        self.node_id = node_id
        self.healthy = True

    def tp_all_reduce(self, tensor):
        if not self.healthy:
            raise ShardGroupUnhealthy(f"shard group on {self.node_id} already marked unhealthy")
        work = dist.all_reduce(tensor, op=dist.ReduceOp.SUM, group=self.tp_group, async_op=True)
        if not work.wait(timeout=ALL_REDUCE_TIMEOUT):
            self.healthy = False
            raise ShardGroupUnhealthy(f"all-reduce timed out after {ALL_REDUCE_TIMEOUT} on {self.node_id}")
        return tensor

    def pp_send(self, tensor, dst_rank: int):
        dist.send(tensor, dst=dst_rank, group=self.pp_group)

    def pp_recv(self, tensor, src_rank: int):
        dist.recv(tensor, src=src_rank, group=self.pp_group)

The embedding table and the final lm_head projection are also sharded, column-parallel across the vocabulary dimension, since a 128k-token vocabulary at hidden size 8192 is itself hundreds of megabytes. After the last layer, each GPU holds logits for only its slice of the vocabulary, and the sampler needs the full distribution, so this is the one place an all-gather replaces the all-reduce: there is nothing to sum, only pieces to concatenate.

What would break without a dedicated coordinator: every model layer would call dist.all_reduce directly with no timeout, and a single crashed peer would hang every other GPU in the group indefinitely, since NCCL’s default collective calls block until the group agrees. There would be no eviction path, just a replica that silently stops making progress while its GPUs report full utilization.

Real World

PyTorch’s distributed backend added asynchronous error handling and watchdog timeouts to NCCL process groups specifically because production training and inference jobs kept hanging indefinitely on a single dead peer with no automatic way to detect it. TensorRT-LLM and DeepSpeed-Inference both build their own health-check layer on top of raw NCCL for the same reason.

The Checkpoint Loader

The loader’s job is to read only the tensors this specific GPU owns, verify them against a known-good checksum, and hand them to the model in the exact shape the sharding plan expects.

The non-obvious part: the failure mode to design against is not “the file is missing,” it is “the file loads successfully but is the wrong shard.” A checkpoint produced for a TP=8 layout, loaded by a replica running TP=4, will load without error and produce fluent, plausible, wrong output, because every tensor has a valid shape, just not the shape this shard plan expects it to have.

# Shard checkpoint loader: reads only the local rank's tensors, verifies against a manifest checksum
import hashlib
from pathlib import Path
from safetensors import safe_open

def load_local_shard(shard_dir: Path, tp_rank: int, pp_stage: int, manifest: dict) -> dict:
    shard_name = f"model-tp{tp_rank:02d}-pp{pp_stage:02d}.safetensors"
    shard_path = shard_dir / shard_name
    expected = manifest["shards"][shard_name]["sha256"]

    digest = hashlib.sha256()
    with open(shard_path, "rb") as f:
        for chunk in iter(lambda: f.read(1 << 20), b""):
            digest.update(chunk)
    actual = digest.hexdigest()
    if actual != expected:
        raise ValueError(f"checksum mismatch on {shard_name}: expected {expected}, got {actual}")

    tensors = {}
    with safe_open(str(shard_path), framework="pt", device="cuda") as f:
        for key in f.keys():
            tensors[key] = f.get_tensor(key)
    return tensors

A shard plan is declared once and consumed by every replica in a group, so the config itself is the contract between the planner and the loader:

# shard-plan.yaml: declarative deployment config consumed by the placement engine
replica_group:
  name: llama3-70b-fp16-primary
  tp_degree: 4
  pp_degree: 2
  dtype: fp16
  gpus_per_replica: 8
  nvlink_domain: node-local
  kv_cache_cap_gb: 20
  max_concurrent_sequences: 256
  checkpoint:
    manifest_uri: s3://models/llama3-70b/fp16/manifest.json
    shard_prefix: "model-tp{tp_rank:02d}-pp{pp_stage:02d}.safetensors"
autoscaling:
  min_replicas: 4
  max_replicas: 24
  scale_on: kv_cache_utilization_pct
  scale_out_threshold: 80
  scale_in_threshold: 35
Watch Out

Loading the full 140GB checkpoint onto a single host’s CPU memory before scattering it to GPUs is a common shortcut that works in a demo and falls over in production, because it requires every loading host to have well over 140GB of free RAM and turns cold start into a single-threaded bottleneck. Read only the shard each GPU owns, directly, from object storage.

The Replica Router

The router’s job is to assign every incoming request to the replica group with enough KV cache headroom, and to keep that decision fast since it sits on the critical path of every request.

// Replica router: assigns a new request to the least-loaded replica group with KV headroom
package router

import (
	"errors"
	"sync"
)

type ReplicaGroup struct {
	ID              string
	TPDegree        int
	PPDegree        int
	KVUsedBytes     int64
	KVCapacityBytes int64
	QueuedRequests  int
}

type Router struct {
	mu       sync.Mutex
	replicas []*ReplicaGroup
}

var ErrNoCapacity = errors.New("no replica group has kv headroom for this request")

func (r *Router) PickReplica(estKVBytes int64) (*ReplicaGroup, error) {
	r.mu.Lock()
	defer r.mu.Unlock()

	var best *ReplicaGroup
	var bestUtil float64 = 1.0

	for _, rg := range r.replicas {
		headroom := rg.KVCapacityBytes - rg.KVUsedBytes
		if headroom < estKVBytes {
			continue
		}
		util := float64(rg.KVUsedBytes) / float64(rg.KVCapacityBytes)
		if best == nil || util < bestUtil {
			best = rg
			bestUtil = util
		}
	}
	if best == nil {
		return nil, ErrNoCapacity
	}
	best.KVUsedBytes += estKVBytes
	best.QueuedRequests++
	return best, nil
}

func (r *Router) Release(rg *ReplicaGroup, kvBytes int64) {
	r.mu.Lock()
	defer r.mu.Unlock()
	rg.KVUsedBytes -= kvBytes
	rg.QueuedRequests--
}

Routing by request count instead of KV cache utilization is the mistake that looks fine until context lengths start varying. A replica group holding a handful of very long conversations can be just as full as one holding many short ones, and a request-count router sends more traffic to the “less busy” group that is actually one allocation away from an admission failure.

Real World

Ray Serve’s model composition layer and NVIDIA Triton’s model instance groups both expose per-replica memory and queue depth as first-class routing signals rather than plain round-robin, specifically because sharded LLM replicas do not degrade gracefully under naive load balancing the way a stateless microservice does.

Data Model

The system tracks three kinds of state: relational metadata about replica groups and the GPUs inside them, a hot-path shard health registry, and collective telemetry events for observability.

-- Shard registry: which GPU holds which (tp_rank, pp_stage) slice of which replica group
CREATE TABLE replica_groups (
    replica_group_id   UUID PRIMARY KEY,
    model_name          TEXT NOT NULL,
    tp_degree           INT NOT NULL,
    pp_degree           INT NOT NULL,
    dtype               TEXT NOT NULL CHECK (dtype IN ('fp16', 'int8', 'fp8')),
    kv_cache_cap_bytes  BIGINT NOT NULL,
    status              TEXT NOT NULL CHECK (status IN ('provisioning', 'healthy', 'degraded', 'draining', 'dead')),
    created_at          TIMESTAMPTZ NOT NULL DEFAULT now()
);

CREATE TABLE gpu_shards (
    gpu_id              TEXT PRIMARY KEY,
    replica_group_id    UUID NOT NULL REFERENCES replica_groups(replica_group_id),
    node_id             TEXT NOT NULL,
    tp_rank             INT NOT NULL,
    pp_stage            INT NOT NULL,
    weight_bytes        BIGINT NOT NULL,
    kv_used_bytes       BIGINT NOT NULL DEFAULT 0,
    last_heartbeat      TIMESTAMPTZ NOT NULL DEFAULT now(),
    UNIQUE (replica_group_id, tp_rank, pp_stage)
);
CREATE INDEX idx_gpu_shards_group ON gpu_shards (replica_group_id, pp_stage, tp_rank);

CREATE TABLE checkpoint_manifests (
    manifest_id         UUID PRIMARY KEY,
    model_name           TEXT NOT NULL,
    dtype                TEXT NOT NULL,
    shard_uri_prefix     TEXT NOT NULL,
    total_bytes           BIGINT NOT NULL,
    shard_count           INT NOT NULL,
    created_at            TIMESTAMPTZ NOT NULL DEFAULT now()
);

The collective telemetry stream, emitted by the NCCL Collective Coordinator on every all-reduce, all-gather, and send/recv, is high-volume and short-lived, so it is modeled as an event, not a row that gets updated:

// Collective telemetry event: emitted by the NCCL coordinator on every all-reduce and send/recv
syntax = "proto3";

package aisd.sharding;

message CollectiveEvent {
  string replica_group_id = 1;
  string gpu_id = 2;
  string op_type = 3;       // "all_reduce", "all_gather", "send", "recv"
  int64 bytes = 4;
  double duration_ms = 5;
  int32 group_size = 6;     // number of ranks participating (tp_degree for all_reduce)
  int64 timestamp_ms = 7;
  bool timed_out = 8;
}

The shard health registry sits in Redis rather than the relational store, since the router and coordinator both need sub-millisecond lookups on the request path:

HSET shardhealth:replica-03 tp_rank_0 "healthy" tp_rank_1 "healthy" tp_rank_2 "healthy" tp_rank_3 "degraded"
EXPIRE shardhealth:replica-03 30
ZADD replica_kv_util 0.82 "replica-03"

Partitioning key choice here is replica_group_id for gpu_shards, since every shard’s lifecycle belongs to exactly one replica group, and model_name plus dtype for checkpoint_manifests, since a new quantization mode needs an entirely new manifest, not a patch of an existing one.

Lifecycle diagram showing a GPU shard moving through provisioning, checksum verification, healthy, degraded, and dead states, with the shard health registry entry updated at each transition

Key Algorithms and Protocols

Megatron-Style Tensor-Parallel Sharding

Already covered in the tensor-parallel shard group section above. The communication volume per all-reduce scales with the message size (hidden size times batch size times bytes per element), and the count of collectives per token is fixed at two per transformer layer in this stage, independent of batch size.

Ring All-Reduce Cost Model

The property that makes tensor parallelism viable at all is that NCCL’s ring all-reduce cost has two separate terms, a bandwidth term that scales with message size and a latency term that scales with the number of ranks in the group, and which term dominates depends entirely on whether you are in prefill or decode.

# Theoretical ring all-reduce latency: bandwidth term plus per-hop latency term
def ring_all_reduce_ms(message_bytes: int, num_ranks: int, bandwidth_gbps: float, per_hop_latency_us: float) -> float:
    bandwidth_bytes_per_ms = bandwidth_gbps * 1e9 / 1000  # GB/s -> bytes/ms
    bandwidth_term_ms = 2 * (num_ranks - 1) / num_ranks * (message_bytes / bandwidth_bytes_per_ms)
    latency_term_ms = 2 * (num_ranks - 1) * (per_hop_latency_us / 1000)
    return bandwidth_term_ms + latency_term_ms

# Decode-time: one token's activation vector, hidden=8192, fp16
decode_msg_bytes = 8192 * 2
nvlink_decode_ms = ring_all_reduce_ms(decode_msg_bytes, num_ranks=4, bandwidth_gbps=600, per_hop_latency_us=1.0)

# Prefill-time: a 2048-token chunk's activations, same hidden size
prefill_msg_bytes = 2048 * 8192 * 2
nvlink_prefill_ms = ring_all_reduce_ms(prefill_msg_bytes, num_ranks=4, bandwidth_gbps=600, per_hop_latency_us=1.0)

At decode time the message is a single token’s activation vector, roughly 16KB, so the bandwidth term is negligible and the latency term, driven purely by hop count and per-hop latency, dominates. At prefill time the message is the whole chunk’s activations, megabytes rather than kilobytes, so the bandwidth term dominates instead. This is exactly why NVLink’s low per-hop latency matters most for decode while its high bandwidth matters most for prefill, and why running a TP group across InfiniBand is survivable for prefill throughput but corrosive to decode-time TPOT: at 80 layers times 2 all-reduces per stage, that per-hop latency penalty is paid roughly 160 times over the life of one generated token.

Key Insight

The property that makes tensor parallelism correct, not just fast, is that every all-reduce boundary is a hard synchronization point. The next layer cannot start until every rank has the summed result, so the availability of a TP group is the availability of its single slowest member, not its average member.

Pipelined Micro-Batch Scheduling

Already covered in the pipeline stage runtime section. Time complexity per scheduling tick is O(active_microbatches), and the edge case worth naming explicitly is a micro-batch that fails mid-stage: the scheduler has to be able to drain it from the pipeline without stalling every other micro-batch behind it, which is why per-microbatch readiness tracking, not a single pipeline-wide barrier, is the correct implementation.

Scaling and Performance

Tensor parallelism and pipeline parallelism both scale the memory a single replica can address, but neither one scales past its own ceiling: a TP group cannot grow past the NVLink domain without paying InfiniBand’s latency tax, and a PP stage cannot shrink its idle bubble below what its micro-batch count allows. What does scale cleanly is the number of replica groups, each an independent 8-GPU unit, fanning out across more nodes as load grows.

Scaling diagram showing multiple replica groups fanning out from the router, each an 8-GPU TP4/PP2 unit, alongside a quantized replica variant that packs four times as many smaller replicas onto the same GPUs
Given:
  - 70B params, FP16 = 140GB weights total
  - 8x A100 80GB per node, hybrid plan: TP=4, PP=2 (one replica = 8 GPUs = 1 node)
  - KV cache per token, unsharded = 2 * 80 layers * 8 kv heads * 128 head_dim * 2 bytes = 327,680 bytes (~0.31 MB)
  - Per-GPU shard KV cache per token = 327,680 bytes / (tp_degree * pp_degree) = 327,680 / 8 = 40,960 bytes (40 KB)
  - KV cache budget per shard = 20 GB = 20,971,520 KB

Token capacity per GPU shard: 20,971,520 KB / 40 KB = 524,288 tokens
Concurrent sequences per replica (avg context 2,048 tok): 524,288 / 2,048 = 256
Aggregate decode throughput per replica: 256 seqs * 40 tok/s = 10,240 tokens/s

Demand: 400 req/s arrival, avg 300 output tokens/request = 120,000 output tokens/s
Replicas needed: 120,000 / 10,240 = ~12 replicas = 12 nodes = 96 GPUs

The concurrency ceiling per replica is set by whichever pipeline stage’s KV cache fills up first, and in a symmetric TP4/PP2 layout both stages fill at the same rate, so the ceiling is clean. An asymmetric split, say more layers in stage 0 than stage 1 to balance an uneven attention-to-MLP ratio, would mean the smaller stage’s KV cache becomes the binding constraint on the entire replica, since a sequence needs cache resident on both stages simultaneously.

This design composes with prefill-decode disaggregation rather than competing with it: nothing here prevents running a dedicated prefill replica pool and a dedicated decode replica pool, each internally sharded with its own TP/PP plan tuned for its own workload shape.

Real World

Alpa, the automatic parallelization research system, and NVIDIA’s own deployment guidance for TensorRT-LLM both converge on the same rule: keep tensor parallelism inside a single NVLink or NVSwitch domain, and use pipeline or data parallelism for anything that has to cross a slower interconnect, because every attempt to stretch tensor parallelism across nodes runs into the exact latency wall the ring all-reduce cost model predicts.

Cost and Token Economics

The dollar case for a sharding plan is driven less by which parallelism strategy is faster and more by how many replicas fit on the same fixed set of GPUs. A node’s 8 GPUs cost the same $/hour no matter how they are partitioned; the question is how many tokens per second come out the other side.

ConfigurationGPU-hours / 1M output tokensCost / 1M tokens (at $2.80/GPU-hr)Concurrent seqs / replicaReplicas / nodeNotes
TP=8, PP=1, FP160.217$0.612561Lowest per-token latency, largest all-reduce group, one dead GPU stalls everything
TP=4, PP=2, FP16 (chosen)0.210$0.592561Smaller all-reduce groups, one stage handoff, similar cost to TP-only
TP=4, PP=1, FP80.207$0.581282Half the weight footprint, twice the replica density, small precision cost
TP=2, PP=1, INT80.193$0.54644Quarter the weight footprint, four times the replica density, largest precision cost

The measured optimization here is replica density, not communication tuning: moving the primary fleet from TP=8/PP=1 FP16 to TP=2/PP=1 INT8 cuts cost per million output tokens by roughly 11% (from $0.61 to $0.54), simply by packing 4 replicas onto the same 8 GPUs instead of 1, even though each individual replica now serves a quarter of the concurrent sequences.

Cost Math

The single highest-leverage cost lever here is not the parallelism strategy, it is how many replicas fit on the same 8 GPUs, and quantization is what changes that number. Tuning TP degree against PP degree at a fixed dtype only moves cost per million tokens by a few percent; changing dtype from FP16 to INT8 moves replica density by 4x.

Quality, Evaluation, and Guardrails

The correctness bar for a sharding change is different from the correctness bar for a model change. Because a 70B model cannot run unsharded on a single GPU, there is no ground-truth single-GPU baseline to diff against, so the practical bar is cross-validation between shard plans: a new candidate plan’s output has to match a trusted reference plan’s output within a bounded tolerance on a golden eval set, not match some unsharded ideal that cannot physically be produced.

Even at FP16, “match” does not mean bit-identical the way it would for a pure data-movement change. All-reduce sums partial results in an order that depends on the ring topology, and floating-point addition is not associative, so two different TP degrees can produce tiny numerical differences that compound over 80 layers and many decode steps. The gate is a perplexity delta, not a token diff.

# Quality gate: blocks a new shard plan rollout if perplexity drifts too far from the baseline plan
import math

MAX_PERPLEXITY_DELTA_PCT = 0.5  # percent

def evaluate_shard_plan(golden_logprobs_baseline: list[float], golden_logprobs_candidate: list[float]) -> dict:
    ppl_baseline = math.exp(-sum(golden_logprobs_baseline) / len(golden_logprobs_baseline))
    ppl_candidate = math.exp(-sum(golden_logprobs_candidate) / len(golden_logprobs_candidate))
    delta_pct = abs(ppl_candidate - ppl_baseline) / ppl_baseline * 100
    return {
        "baseline_ppl": ppl_baseline,
        "candidate_ppl": ppl_candidate,
        "delta_pct": delta_pct,
        "pass": delta_pct <= MAX_PERPLEXITY_DELTA_PCT,
    }

Offline, the golden set runs against both the current production shard plan and any candidate plan (a new TP/PP degree, a new quantization mode) before it takes traffic. Online, a low-rate shadow comparison mirrors a small percentage of live requests to both plans and tracks the same perplexity delta continuously, since a plan that passes the golden set can still drift on live traffic distribution. The guardrail on the admission path is simpler: reject a request outright if its estimated context length would exceed the per-shard KV cache budget, rather than admitting it and failing mid-generation.

Watch Out

A shard plan that is wrong in a subtle way, say a TP rank loaded the wrong slice of the O projection weight, does not crash. It produces fluent, plausible, and wrong tokens indistinguishable from ordinary model variance in a quick smoke test, and only shows up as a slow perplexity creep on a monitoring dashboard days later.

Failure Modes and Recovery

FailureDetectionImpactRecovery
NCCL all-reduce timeout in a TP groupcollective wait() exceeds timeoutentire TP group stalls, every sequence on that stage frozencoordinator marks group unhealthy, router drains and evicts the replica, in-flight requests re-queued
GPU OOM mid-generation (KV cache overrun)block allocator returns no free blocks on admissionnew sequence cannot be admitted to that shardrouter picks a different replica group before assignment, existing sequences unaffected
Checkpoint shard checksum mismatch at cold startsha256 mismatch in load_local_shardreplica fails to come uporchestrator retries download from object store, pages on-call if mismatch persists
Pipeline stage GPU crashheartbeat miss on gpu_shards tableevery sequence in flight through that stage is lostreplica group marked dead, drained from router, GPUs re-provisioned and reloaded from the checkpoint manifest
NVLink link degrades to PCIe fallbackper-collective duration p99 spike without a hard timeoutTPOT degrades gradually, not a hard failurealert on collective duration percentiles, cordon the node for maintenance if sustained
InfiniBand link flap on a cross-node pipeline boundarysend/recv timeout at the PP stage boundaryactivations stuck mid-pipeline, downstream stage starvesretry the send/recv once, drain and re-route the replica if it fails again
Watch Out

The most common operational mistake is monitoring GPU utilization percentage as the health signal for a tensor-parallel group. A hung NCCL collective can leave every GPU in the group at 100% utilization spinning in a wait loop, looking perfectly healthy on a utilization dashboard while serving zero tokens.

Comparison of Approaches

ApproachLatency (decode)Cost (GPU-hr / 1M tok)ComplexityFailure modeBest fit
Full replication, FP16, no shardingN/AN/ALow140GB does not fit in 80GB, fails at load timeNever, for a model this size; only viable when the model already fits on one GPU
Tensor parallelism only (TP=8, PP=1)Lowest per-token, all layers active every step~0.217MediumOne dead rank stalls the entire 8-way groupSingle node, latency-critical decode, NVLink domain covers all GPUs
Pipeline parallelism only (PP=8, TP=1)Highest, bubble-bound at low concurrency~0.24 (typical)MediumOne stage crash stalls the whole chain; low concurrency wastes cycles in bubblesModel too large for any single NVLink domain, or very high, steady concurrency
Hybrid TP+PP (TP=4, PP=2, chosen)Slightly higher than TP-only per hop, stays inside NVLink~0.210HighFailures now come from two axes: TP group health and PP stage healthModel needs more shards than one TP group’s communication budget comfortably allows, still fits in one node
Quantization-only (INT8, TP=2, PP=1, 4x density)Comparable per sequence, lower ceiling per replica~0.193, cheapestMedium, plus a quantization validation pipelinePrecision loss can silently shift the output distribution if calibration driftsCost-sensitive fleets that can tolerate a small, measured, monitored quality delta

For a single 8-GPU node serving a model this size with no tolerance for precision loss, the hybrid TP=4/PP=2 plan is the right default: it keeps every all-reduce inside the NVLink domain, halves the blast radius of a single GPU failure compared to TP=8, and costs within a few percent of the fastest pure-TP option. Teams under real cost pressure who can afford, and can measure, a bounded quality delta should push toward the quantization-only end of the spectrum, since replica density is a bigger lever than any communication-pattern tuning at a fixed dtype.

Key Takeaways

  • Tensor parallelism shards every matrix multiply inside a layer using Megatron-style column-then-row splits, keeping all GPUs active on every layer at the cost of an all-reduce after every attention and MLP block.
  • Pipeline parallelism shards layers between GPUs instead of within them, trading all-reduce cost for idle bubble time that shrinks as concurrency, whether micro-batches or concurrent decode sequences, grows.
  • NVLink domain boundaries are the real constraint on tensor parallelism degree; crossing onto InfiniBand for TP communication adds enough per-hop latency, paid roughly 160 times per token, to threaten decode-time TPOT budgets.
  • The KV cache budget per shard is a concurrency lever, not just a safety margin. Every gigabyte reserved there is concurrent sequences you can or cannot serve.
  • Quantization reduces shard count by shrinking weight footprint, letting more replicas fit on the same physical GPUs, which is usually a bigger cost lever than tuning the parallelism strategy itself.
  • The checkpoint manifest and shard checksum matter as much as the parallelism math, since a silently corrupted or mismatched shard produces plausible, wrong output with no crash to flag it.
  • A hung NCCL collective looks healthy on a utilization dashboard. GPU utilization alone is not a valid health signal for a tensor-parallel group.
  • Replica routing by KV cache headroom, not request count, keeps shard groups balanced as context length variance grows across traffic.

The counter-intuitive lesson is that adding more communication, tensor parallelism’s frequent all-reduces, is often faster than adding less, pipeline parallelism’s rare but blocking handoffs, as long as that communication stays inside a domain fast and low-latency enough to make it nearly free. The real design skill is not choosing tensor parallelism over pipeline parallelism, it is knowing which hardware boundary each one is allowed to cross.

Frequently Asked Questions

Q: Why not just use pipeline parallelism across all 8 GPUs and skip tensor parallelism’s all-reduce overhead entirely? A: Pure pipeline parallelism avoids all-reduce cost but pays for it in idle bubble time, which is worse at low-to-moderate concurrency and only amortizes once enough independent micro-batches are in flight. It also concentrates failure blast radius differently: a single stage crash in an 8-deep pipeline stalls the entire chain, versus half the GPUs in a 4-deep hybrid stage.

Q: Why not skip sharding altogether and run 8 independent replicas of a heavily quantized, single-GPU-sized version of the model instead? A: That is a legitimate design, and it is the quantization-only row in the comparison table above, but it changes the product, not just the infrastructure. Aggressive quantization, 4-bit and below, on a 70B model measurably degrades quality on reasoning-heavy tasks, while sharding a full-precision or lightly-quantized model preserves quality at the cost of lower replica density.

Q: What is the actual dollar impact of choosing TP=4/PP=2 over TP=8/PP=1? A: At $2.80 per GPU-hour, the hybrid plan trims cost per million output tokens from roughly $0.61 to $0.59, a low single-digit percentage. That makes it primarily a reliability and communication-pattern decision, not a cost decision. Real cost impact comes from quantization-driven replica density, which moves the number by closer to 10 to 15 percent.

Q: How do you know a new shard plan does not silently produce worse outputs before it takes production traffic? A: Cross-validate against a trusted alternate shard plan on a golden eval set, since there is no unsharded single-GPU baseline for a model this size, gate any candidate behind a bounded perplexity delta, and mirror a small percentage of live traffic to both plans for an online check before fully cutting over.

Q: What happens if the model does not divide evenly across your chosen TP or PP degree? A: The number of KV heads must divide evenly by the TP degree, since grouped-query attention heads cannot be split mid-head, and the number of layers must divide evenly by the PP degree for balanced stage sizes. If it does not, either choose a compatible degree or let the planner assign uneven layer counts per stage and accept that the smaller stage’s KV cache becomes the binding concurrency constraint.

Q: Does this design change if you need to serve a model that needs more than 8 GPUs? A: Yes, that is exactly where pipeline parallelism has to cross the node boundary. Tensor parallelism degree should stay capped at the NVLink domain size, and any additional sharding a larger model needs has to come from adding pipeline stages across nodes over InfiniBand, accepting the added per-hop latency at stage boundaries since there is no way around it once the model no longer fits inside one node’s NVSwitch domain.

Interview Questions

Q: Walk through a single decode step for one token in a TP4/PP2 hybrid replica, naming every collective operation that fires. Expected depth: candidate should trace the column-parallel QKV split (no communication), per-GPU local attention, row-parallel output projection with an all-reduce, column-parallel MLP gate/up projections, row-parallel down projection with a second all-reduce, repeated per layer within the stage (40 layers, 80 all-reduces), a send/recv handoff at the stage boundary, and a final vocabulary all-gather before sampling.

Q: How do you size the KV cache budget per GPU shard for a target concurrency, and what happens when you get the TP/PP split wrong in each direction? Expected depth: should derive KV bytes per token from num_layers divided by pp_degree, num_kv_heads divided by tp_degree, head_dim, and dtype size; should explain that too low a TP or PP degree wastes shard-count opportunity and leaves memory idle, while too high a degree either fails to divide evenly or pushes communication onto a slower interconnect than intended.

Q: Why does all-reduce latency, not bandwidth, dominate tensor-parallel communication cost during decode but not during prefill? Expected depth: should recognize decode moves one token’s activation vector per step, a tiny message that is latency-bound, while prefill moves activations for an entire batched chunk at once, a large message that is bandwidth-bound; should connect this to why NVLink’s low latency matters most for decode and its high bandwidth matters most for prefill, and why the two phases tolerate different interconnects.

Q: Your NVLink domain covers 8 GPUs but you need to serve a 140B-parameter model. How does your shard plan change, and what is the new bottleneck? Expected depth: tensor parallelism degree stays capped at 8 or less to stay inside the NVLink domain; additional sharding comes from pipeline stages spanning multiple nodes over InfiniBand; the new bottleneck is per-hop latency and reduced effective bandwidth at the cross-node stage boundary, which now sits directly on the decode critical path.

Q: A shard plan passes every functional test but perplexity creeps up 2 percent over a week in production. What is your debugging process? Expected depth: should not assume a model quality issue first; should check for hardware degradation (a throttling GPU or ECC errors changing numerics inside a TP group), a stale or partially rolled-out checkpoint shard, or a routing bug over-weighting a lower-precision replica group; should describe cross-referencing per-replica-group perplexity rather than a fleet-wide average to isolate which shard plan is actually drifting.

Premium Content

Unlock the full article along with everything else in the archive — all in one place.

In-depth analysis Expert insights Full archive access
Unlock Full Article